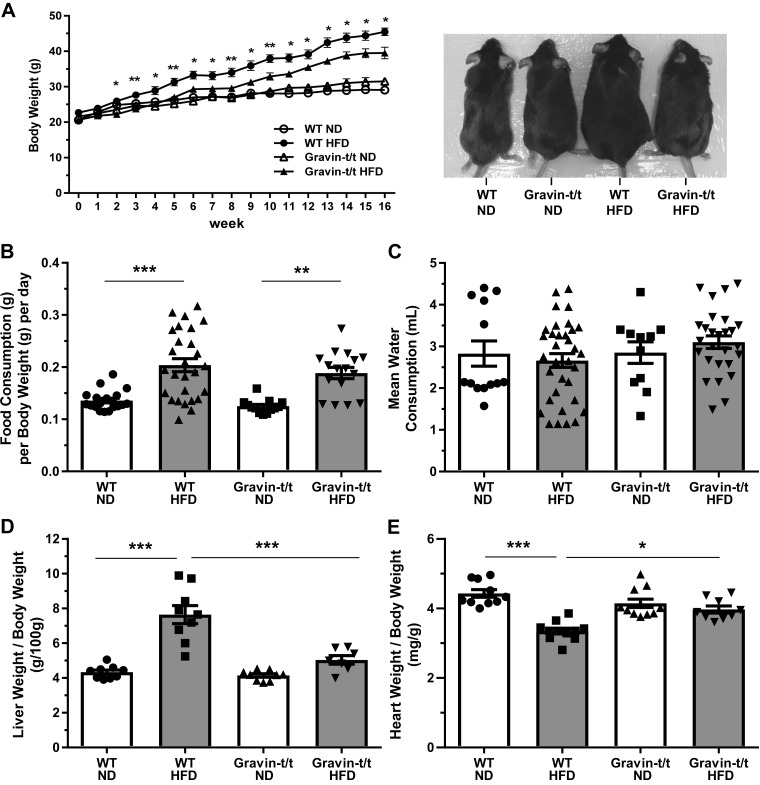
Fig. 1.
Gravin-t/t and wild-type (WT) whole animal response to normal diet (ND) and high-fat diet (HFD). Left shows quantification analysis of body weight, and right shows representative mouse images of each study group (A). Body weights of the mice were collected from 0 to 16 wk. Gravin-t/t HFD mice showed lower body weights compared with WT HFD starting from 2 wk of age. There was no significant body weight difference for ND groups for the 16-wk treatment. *Comparison between HFD-fed WT and Gravin-t/t mice. Results are presented as mean ± SE. n = 6; *P < 0.05 and **P < 0.01. There were no significant differences in food consumption (B) and water consumption (C) between WT and gravin-t/t on the HFD during the 16 wk of treatment. Results are presented as mean ± SE. n = 13; *P < 0.05 and **P < 0.01. Liver weight/body weight ratio (D) and heart weight/body weight ratio (E) of WT and gravin-t/t mice were measured at 16 wk of age. Results are presented as mean ± SE; n = 10 (WT ND), n = 11 (WT HFD), n = 11 (Gravin-t/t ND), n = 9 (Gravin-t/t HFD; D); n = 9 (WT ND), n = 9 (WT HFD), n = 9 (Gravin-t/t ND), n = 7 (Gravin-t/t HFD; E); *P < 0.05; **P < 0.01; ***P < 0.001. Comparisons between two groups were determined by an unpaired two-tailed Student’s t test, and comparisons between multiple groups were determined by one-way ANOVA followed by post hoc Tukey test.

