Fig. 3.
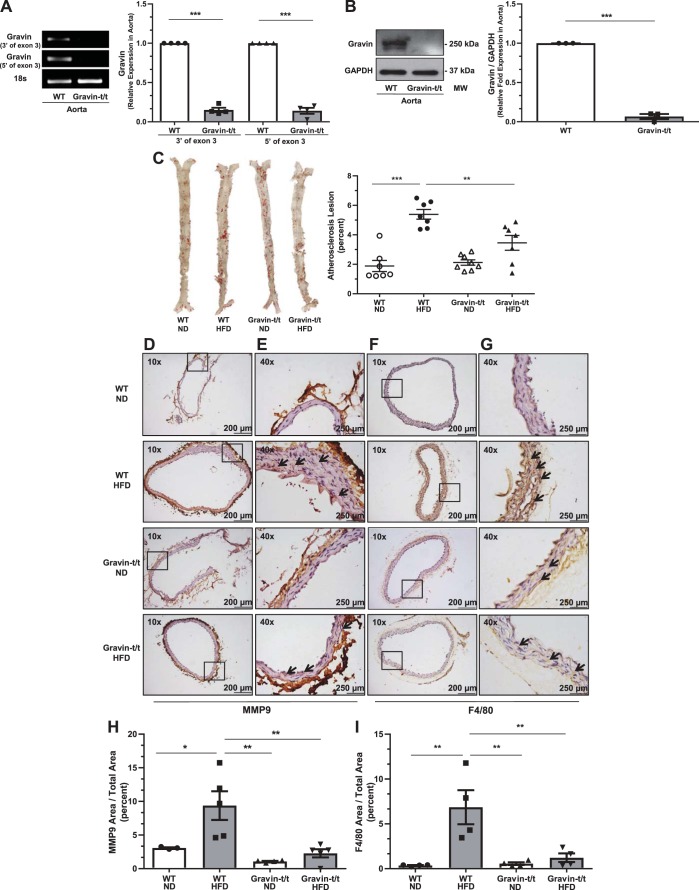
Gravin-t/t mice show resistance to atherosclerosis induced by high-fat diet (HFD). Gravin mRNA expression in the aorta was quantified by reverse transcriptase quantitative PCR from wild-type (WT) and gravin-t/t mice (A). Gravin-specific primers amplified regions of exon 3 that were either 3′ or 5′ of the exon. The aorta from gravin-t/t mice showed significantly decreased gravin mRNA expression compared with WT mice. Results are presented as mean ± SE. n = 4; ***P = 0.0006. Gravin protein expression was measured in the aorta by Western blot from WT and gravin-t/t mice, where the gravin antibody recognized the monomeric (250 kDa) forms of the gravin protein (B). The aorta from gravin-t/t mice showed significantly decreased gravin protein expression compared with WT mice. Results are presented as mean ± SE. n = 3; ***P < 0.001. Dissected whole aortas were isolated from gravin-t/t and WT mice and stained with Oil Red O solution following 16 wk treatment with either normal diet (ND) or HFD, where representative whole aorta images show atherosclerotic plaques (C). Aortas were then quantified for atherosclerotic plaque formation using Image-Pro Plus. Results are presented as mean ± SE. n = 7 (WT ND), n = 7 (WT HFD), n = 8 (Gravin-t/t ND), and n = 8 (Gravin-t/t HFD); **P < 0.01 and ***P < 0.001. Cross sections of paraffin-embedded thoracic and abdominal aortas (D–G) were stained with matrix metalloproteinase (MMP)-9 (D and E) and F4/80 antibodies (F and G). Images were measured using brightfield Nikon microscopy at ×10 (D and F) and ×40 (E and G). Gravin-t/t HFD-fed mice showed lower aortic MMP-9 and aortic F4/80 expression compared with WT HFD-fed mice. Arrows indicate the expression of the protein of interest. Boxed areas shown in D and F are shown in higher magnification in E and G, respectively. MMP-9 area to total area (H) and F4/80 area to total area (I) were both decreased in gravin-t/t HFD-fed mice compared with WT HFD-fed mice. Results are presented as mean ± SE. n = 3 (WT ND), n = 5 (WT HFD), n = 4 (Gravin-t/t ND), and n = 5 (Gravin-t/t HFD) (H); n = 4 for each group (I). *P < 0.05, **P < 0.01, and ***P < 0.001. Comparisons between two groups were determined by an unpaired two-tailed Student’s t test, and comparisons between multiple groups were determined by one-way ANOVA followed by post hoc Tukey test. MM, molecular mass.

