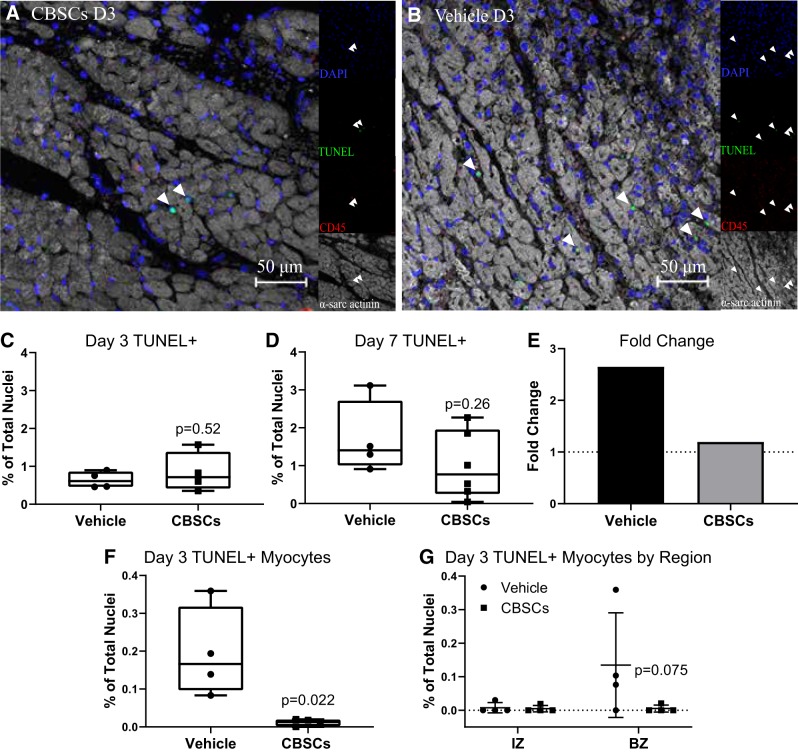
Fig. 1.
CBSC treatment reduces apoptosis in the infarcted myocardium. Quantification of fluorescent staining of swine tissue. Representative border zone (BZ) images of the immunofluorescence staining at day 3 (D3) (A and B). Average total TUNEL+ cell counts in the IZ and BZ of CBSC- and vehicle-treated animals 3 days (C) and 7 days (D) after reperfusion were counted by colocalization of TUNEL and DAPI. Fold change (E) reflects the division of the day 7 mean by the day 3 mean for each group. Dotted line represents y = 1. TUNEL+ myocytes were measured by the colocalization of TUNEL and DAPI completely within intact α-sarcomeric actinin+ myocytes (F and G). Percent TUNEL+ Myocytes are expressed as a percentage of total cells counted. Error bars represent ± SD. n = 4 for C, F, and G. n = 4 (vehicle) and 6 (CBSCs) for D. P values reflect the results of unpaired, 2-tailed t tests of CBSCs vs. vehicle (C–F.). For G, P value reflects an ANOVA of CBSCs vs. vehicle in the IZ and BZ with Sidak’s correction for multiple comparisons. CBSC, cortical bone stem cell; IZ, infarct zone; TUNEL, terminal deoxynucleotidyl transferase dUTP nick end labeling.

