Fig. 2.
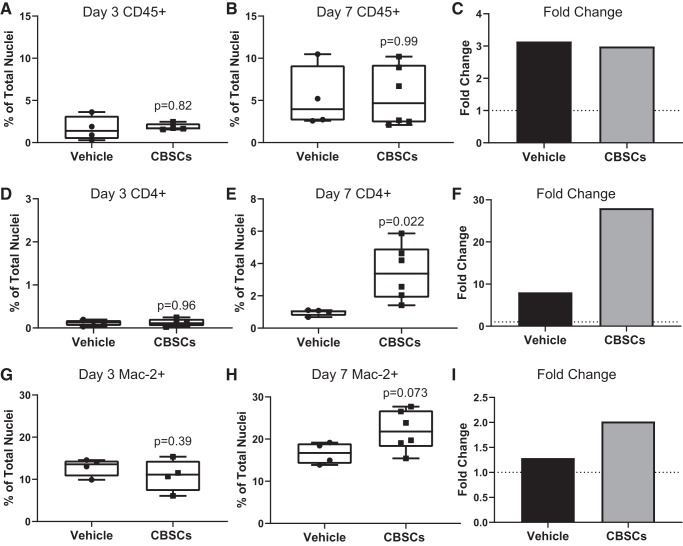
CBSCs increase macrophage and T-cell recruitment but not CD45+ cell number. Quantification of the total number of CD45+ cells in the IZ and BZ of CBSC- and vehicle-treated animals (representative images from Fig. 1) 3 days (A) and 7 days (B) after reperfusion. Cells were counted by colocalization of CD45 and DAPI. Percentage of CD4+ cells as a percent of total nuclei counted at 3 days (D) and 7 days (E) after reperfusion were counted by colocalization of CD4 and DAPI. Percentage of Mac-2+ cells as a percent of total nuclei counted at 3 days (G) and 7 days (H) after reperfusion were counted by colocalization of Mac-2 and DAPI. Fold change (C, F and I) reflects the division of day 7 means by day 3 means for each group. Dotted line represents y = 1. Error bars represent ± standard deviation. n = 4 for A, D, and G. n = 4 (vehicle) and 6 (CBSCs) for B, E, and H. P values reflect the results of unpaired, 2-tailed t tests of CBSCs vs. vehicle. BZ, border zone; CBSC, cortical bone stem cell; IZ, infarct zone.

