Figure 1.
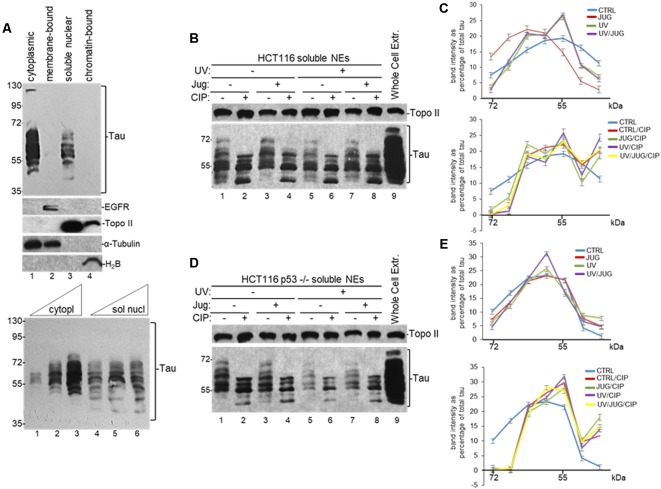
Distribution of nuclear tau forms changes under different cellular conditions. (A) Different tau forms are present in cytoplasmic and soluble nuclear fractions from HCT116 cells. Equivalent amounts of total protein content from each sample obtained by subcellular fractionation kit were analyzed by SDS-PAGE. Tau forms were detected using monoclonal tau-13 antibody (Alonso et al., 2010). Antibodies against epidermal growth factor receptor (EGFR), topoisomerase II (Topo II), α-Tubulin, and histone H2B were used as controls for each fraction. Bottom panel: increasing amounts of cytoplasmic (5, 15 and 30 μg of total protein) and soluble nuclear (30, 45 and 60 μg of total protein) fractions were loaded to detect different tau forms. A representative Western blot from three independent biological assays is shown. (B–E) Distribution of nuclear tau forms changes upon Pin1 inactivation, p53 expression, UV irradiation and calf intestinal phosphatase (CIP) treatment. (B) HCT116 and (D) HCT116 p53−/− cells were treated with juglone (5 μM) for 2 h, and/or exposed to UV irradiation (40 Jm−2) and allowed to recover for 2 h before nuclear extracts (NEs) were prepared. NEs were treated with CIP as indicated. Samples were analyzed by immunoblotting with the indicated antibodies. Antibody against Topo II was used as loading control. Whole-cell extracts were also analyzed. A representative Western blot from three independent biological assays is shown. (C,E) Band intensities of tau forms detected between 72- and 35-kDa in (B,D), respectively, were plotted as percentage of total tau expression in each condition. Blots were arbitrarily divided into seven regions for quantification. The data shown are mean ± SEM from three independent biological experiments. Quantifications were done using ImageJ software (http://rsb.info.nih.gov/ij/).

