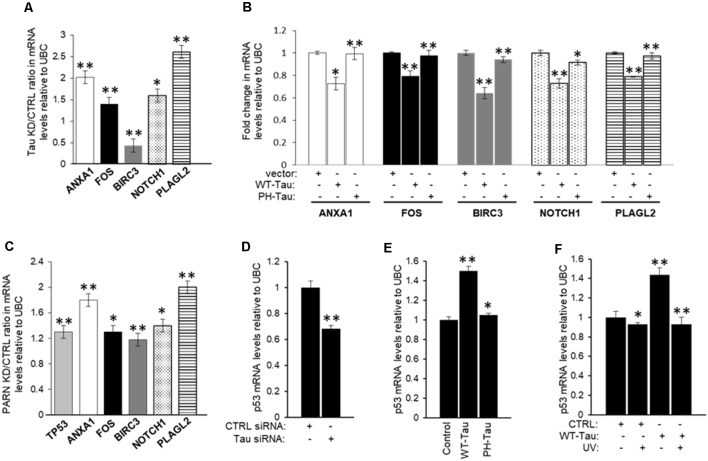
Figure 7.
Expression of a group of mRNAs deregulated in cancer and/or Alzheimer’s disease (AD) is targeted by tau, Pin1 and PARN. (A) Effect of tau knockdown on endogenous gene expression of selected targets. Real-time reverse transcription polymerase chain reaction (qRT-PCR) analysis of ANXA1, FOS, BIRC3, NOTCH1, and pleomorphic adenoma gene-like 2 (PLAGL2) expression using RNA samples from HCT116 cells treated with either MAPT or control siRNAs for 48 h (as in Figure 4A). Fold changes were calculated using the ΔΔCT method as described (Devany et al., 2013). Tau knockdown/control ratios were calculated and plotted as shown. Ubiquitin C (UBC) levels were used as endogenous control. The data shown are mean ± SEM from three independent biological experiments. The P-values are indicated as *(≤0.05) or **(≤0.005). (B) Effect of tau overexpression and phosphorylation at pathological sites on endogenous gene expression of selected mRNA targets analyzed in (A). RNA samples from HCT116 cells transfected with pAc-GFP expression vectors containing WT-Tau or PH-Tau (as in Figure 4B; Alonso et al., 2010) were analyzed as in (A). (C) Effect of PARN knockdown on levels of TP53 and the mRNA targets analyzed in (A). RNA samples were collected from HCT116 cells treated with either PARN or control siRNAs for 48 h. PARN knockdown/control ratios were calculated and plotted as shown. RNA samples were analyzed as in (A). (D) siRNA-mediated knockdown of tau decreases TP53 mRNA levels in HCT116 cells. qRT-PCR analysis of TP53 using nuclear RNA samples from (A). (E,F) WT-Tau overexpression increases TP53 mRNA levels in non-damaging conditions in HCT116 cells. qRT-PCR analysis of TP53 using nuclear mRNA samples from (B) HCT116 cells transfected with pAc-GFP expression vectors containing WT-Tau and PH-Tau (as in Figure 4B; Alonso et al., 2010); and from (C) HCT116 cells transfected with pAc-GFP vectors containing WT-Tau and/or treated with UV (40 Jm−2) and allowed to recover for 2 h. Samples were analyzed as in (A).

