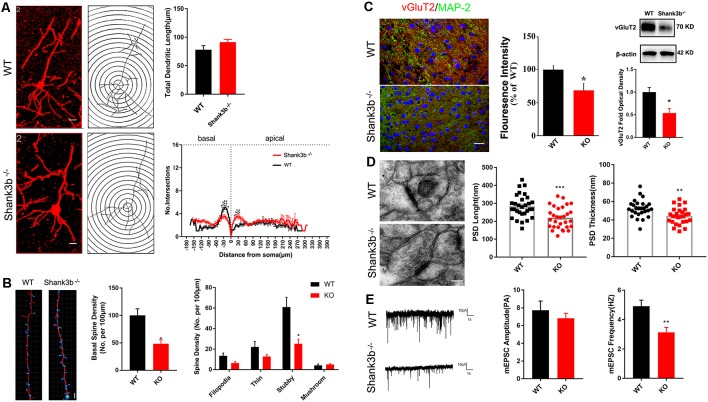
Figure 2.
Effects of Shank3b mutation on the dendrite and synapse development in ACC. (A) Sholl analysis of Golgi images of pyramidal neurons in WT and Shank3b−/− ACC 4 weeks post-birth. Notice the fewer branches in the basal dendrites of Shank3b−/− mice of 4 weeks old. (B) Imaris analysis of spines in basal dendrites of WT and Shank3b−/− neurons. Notice the decrease of total spine density and stubby spines. (C) Double-immunostaining of vesicular glutamate transporter 2 (vGlut2)/MAP2 and Western-blotting of vGluT2. Notice the weaker expression of vGluT2 in Shank3b−/− ACC. (D) Electron microscopic study of synaptic ultrastructure in WT and Shank3b−/− ACC at 4 weeks post-birth. The average length and thickness of post-synaptic density (PSD) was reduced. (E) Patch-clamp recording of miniature excitatory post-synaptic current (mEPSC) in WT and Shank3b−/− ACC. Notice the reduction of frequency of mEPSC in Shank3b−/− ACC. Bars = 2 μm (A,B), 150 μm (C) and 135 nm (D). Values represent mean ± SEM. *P < 0.05. **P < 0.01. N = 6 mice per group in (A,B), 30 neurons per group in (C), five mice per group in (D) and six neurons per group (E). Two-way ANOVA (A), One-way ANOVA (B) and Student’s t-test (C–E).

