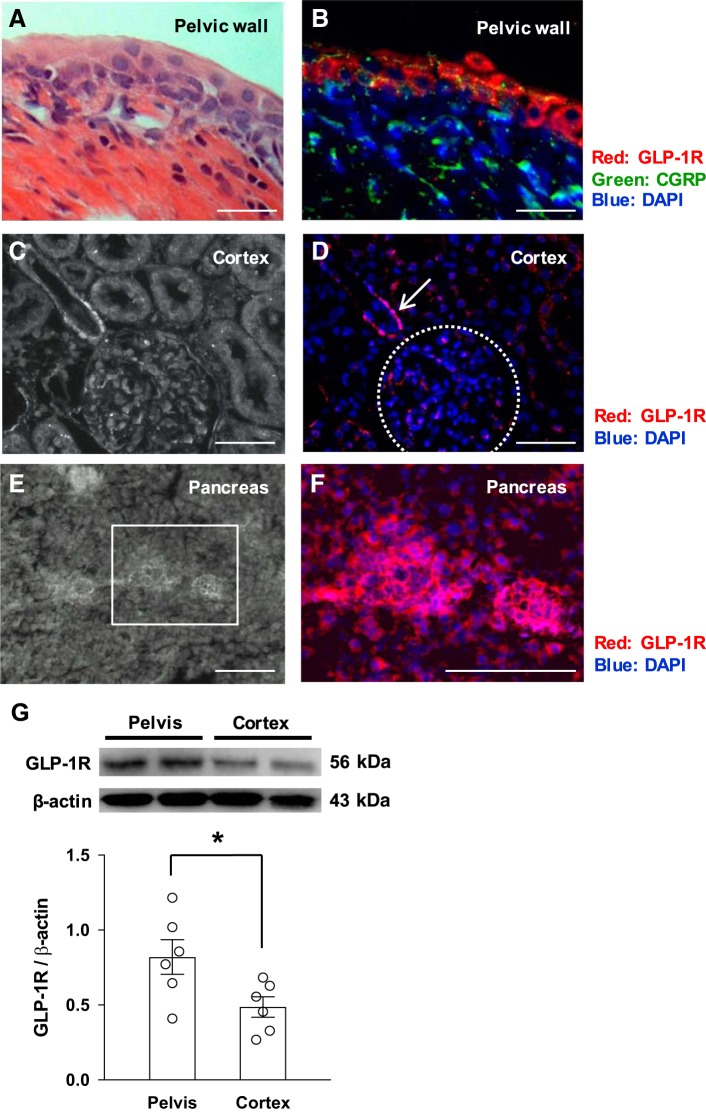
Fig. 2.
A and B: hematoxylin and eosin staining of the renal pelvic wall (A) and near-adjacent section (B) showing immunoreaction to glucagon-like peptide-1 receptor (GLP-1R; red) and calcitonin gene-related peptide (CGRP; green). C and D: images of the renal cortex in white light (C) and the same section (D) showing immunoreaction to GLP-1R (red). Arrow shows the immunoreaction to GLP-1R. The dotted circle shows glomeruli. E: immunofluorescent image of pancreas in white light. F: magnified image of the boxed portion of E. GLP-1R is shown in red. Nuclei were stained with DAPI (blue). G: GLP-1R protein expression in the pelvis and cortex of the kidney. Scale bars = 50 μm in A and B and 100 μm in C–F. n = 6. *P < 0.05.

