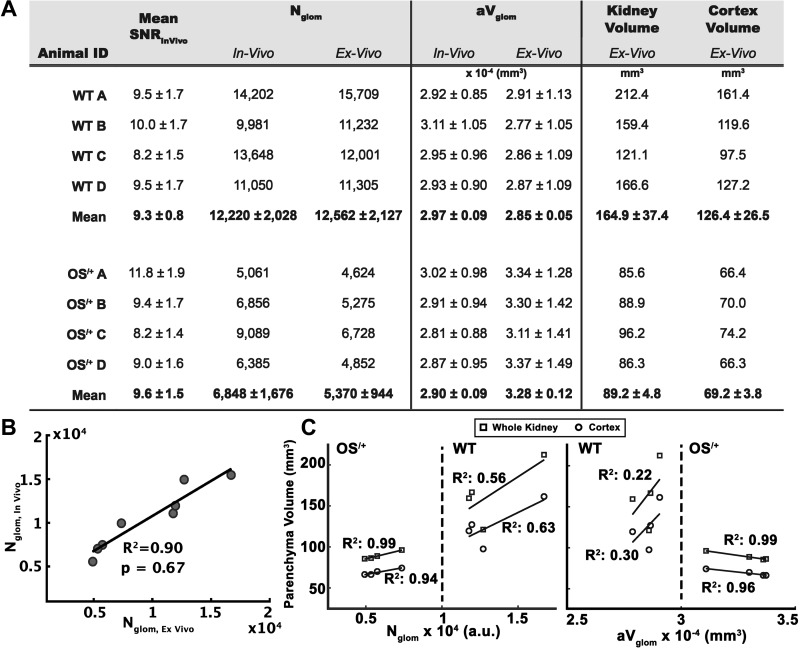
Fig. 2.
Values of signal-to-noise ratio (SNR), glomerular number (Nglom), mean glomerulus volume (aVglom), and kidney and cortical volume measured from in vivo and ex vivo magnetic resonance (MR) images of mouse kidneys. A: measurements from in vivo and ex vivo MRI from wild-type (WT) mice and mice with oligosyndactylism (Os/+). The mean SNR is reported from in vivo MRI images. The difference in Nglom between WT and OS/+ mice was observed in both in vivo and ex vivo measurements. The difference in aVglom was observed in ex vivo MRI but not in vivo. Kidney and cortex volumes were measured in ex vivo MR images of mouse kidneys. B: in vivo and ex vivo measurements of Nglom from MRI (P = 0.67). C: correlation of Nglom and aVglom measured ex vivo with whole kidney and cortex volumes. Errors are reported using SDs.

