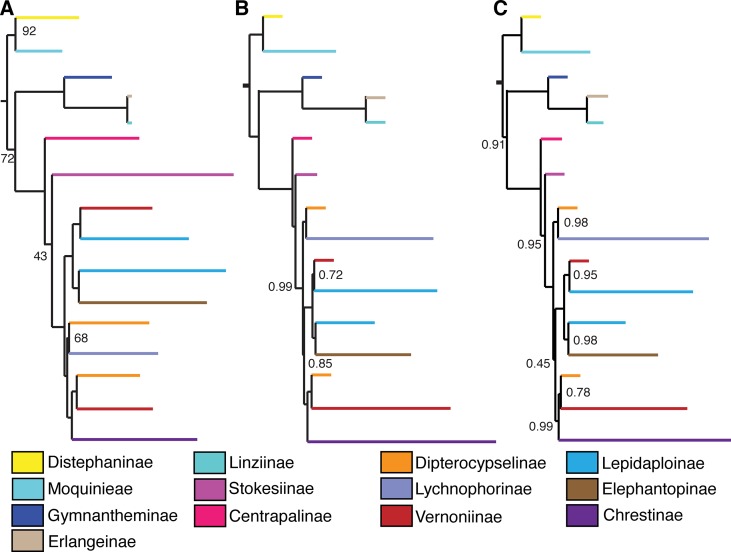
Figure 4.
Comparison between backbone trees obtained with different analysis methods and datasets. (A) 75% matrix, maximum likelihood. (B) Total matrix, pseudocoalescence. (C) 75% matrix, pseudocoalescence. Nodes without a value have 100% bootstrap support or local posterior probability of 1. Subtribes are coded by color.

