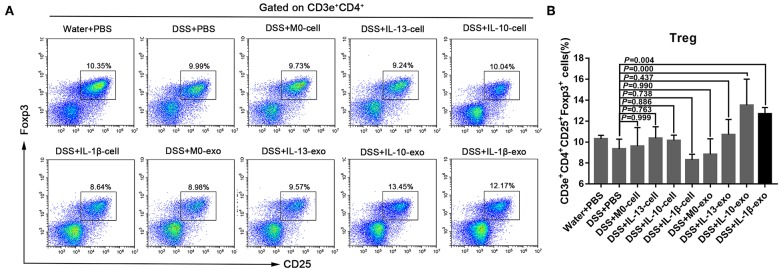
Figure 5.
Splenic Treg subset levels in mice with experimental colitis. (A) Cells were isolated from the spleens of mice and stained with fluorochrome-conjugated antibodies against CD3e, CD4, CD25, and Foxp3. The number of Tregs in the spleens were expressed as percentages of the CD3e+CD4+CD25+Foxp3+ cell population. (B) Statistical analysis of Tregs.

