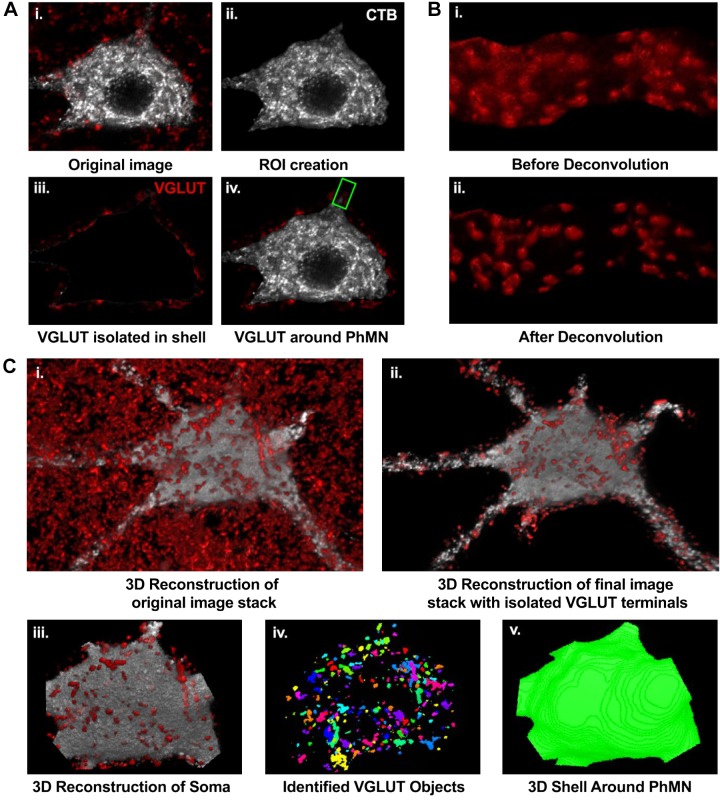
Fig. 3.
Method for 3-dimensional (3D) analyses of vesicular glutamate transporter (VGLUT) terminals at a single phrenic motor neuron (PhMN). A: representative image of single optical slice (i) with visible VGLUT terminals (red) surrounding a single cholera toxin B (CTB)-labeled PhMN (grayscale). Semiautomated processing for VGLUT terminal isolation included thresholding and creation of a region of interest (ROI) encompassing the CTB-labeled PhMN soma (ii), application of a mask to segregate VGLUT-immunoreactive terminals in the PhMN ROI dilated by 2.5 µm (iii), and single-slice image with isolated VGLUT terminals for a selected PhMN (iv). The green ROI represents the selected dendrite for additional steps exemplified in B. Note the first 2 steps were repeated for each optical slice in the image stack for each sampled PhMN. B: all image stacks containing VGLUT terminals segregated at PhMN soma and selected primary dendrites (see materials and methods for details) were subjected to deconvolution (i) in 3D (blind deconvolution using Point Scan Confocal, 3 iterations). Representative image (ii) shows the improved resolution of VGLUT terminals after deconvolution. C: representative 3D reconstruction for the entire PhMN and surrounding VGLUT terminals (i), with segregated terminals to the surrounding shell (ii). With use of the 3D volume measurement plug-in in NIS elements software, the PhMN soma was selected (iii), individual VGLUT terminals were identified (iv), allowing their dimensions to be quantified, and the volume of the shell surrounding the PhMN was obtained in 3D (v).

