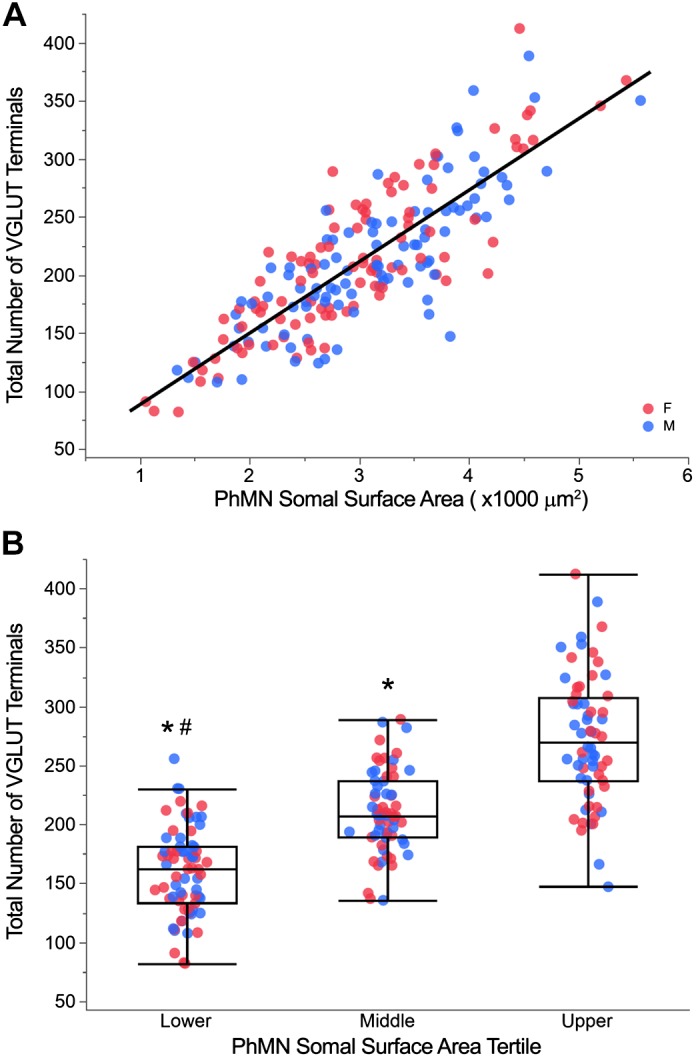
Fig. 6.

Total number of vesicular glutamate transporter (VGLUT) terminals across phrenic motor neurons (PhMNs). A: scatterplot of total number of VGLUT terminals vs. PhMN somal surface area (n = 200 PhMNs from 8 animals). The total number of VGLUT terminals is positively correlated with PhMN somal surface area (P < 0.001; r2 = 0.69), with no difference between female (red) and male (blue) rats. B: outlier whisker box plot of total number of VGLUT terminals across individual PhMNs grouped by tertile of somal surface area for each animal. Boundaries of outlier whisker plots are set at the 25th and 75th quartiles, and the median is represented as a line. *P < 0.05, significantly different compared with upper tertile (Tukey HSD). #P < 0.05, significantly different compared with middle tertile (Tukey HSD).
