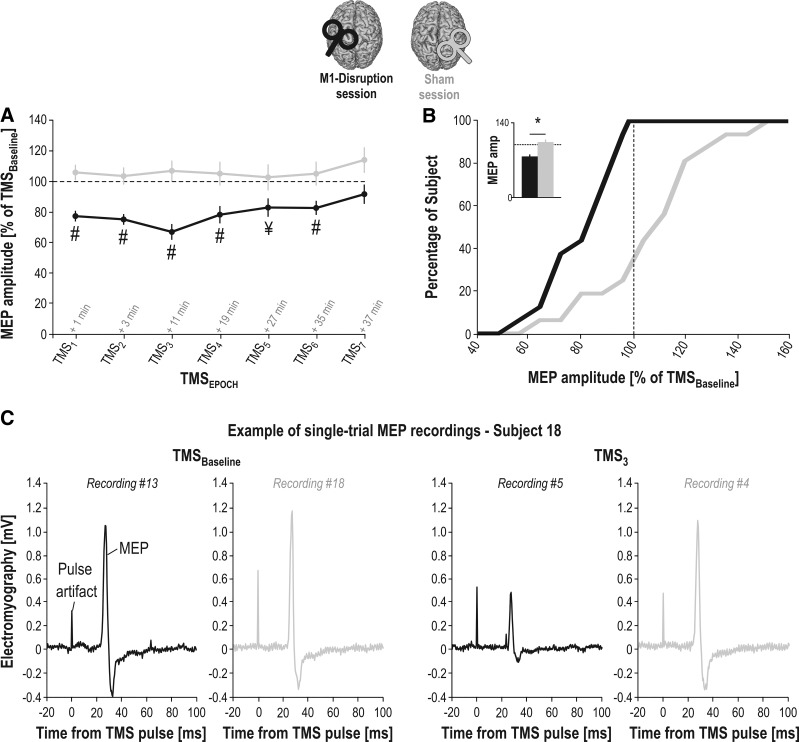
Fig. 4.
Motor evoked potential amplitudes (MEP amp). A: mean value of MEPs (in percentage of MEPs at TMSBaseline) elicited after the continuous theta burst stimulation (cTBS) intervention in the 1st dorsal interosseous muscle at each of the TMSEPOCHS (TMS1–7) in the M1-Disruption (black traces) and Sham (gray traces) sessions. Note the significant disruption of MEPs with respect to baseline (i.e., dashed horizontal line) in the M1-Disruption session [#significantly different from 100 at P < 0.0036 (Bonferroni-corrected); ¥significantly different from 100 at P < 0.05 (uncorrected; P = 0.017)]. B: cumulative percentage of subjects. MEPs obtained at TMS1–7 are pooled together. Note that all subjects included in the analysis showed percentage MEP amplitudes <100% in the M1-Disruption (i.e., a disruptive effect), although the same subjects did not show any effect in the Sham session, as also shown in the inset representing the group-level average with the effect of SESSION (*significantly different at P < 0.05). Error bars represent SE. C: example of single-trial MEP recordings. Each trace depicts a raw electromyographic signal in a representative subject (no. 18), starting 20 ms before the TMS pulse and ending 100 ms after it. Artifact caused by the pulse is reflected as a peak occurring at time 0; the MEP occurs ~22 ms later. The 4 recordings display MEPs elicited at TMSBaseline (left) or TMS3 (right) in the M1-Disruption (black traces) or Sham (gray traces) session. In this subject, cTBS had a strong effect; average percentage MEP amplitudes at TMS3 were much smaller in the M1-Disruption session (66 ± 12.8%) compared with the Sham session (112.6 ± 5.7%). M1, primary motor cortex; TMS, transcranial magnetic stimulation.

