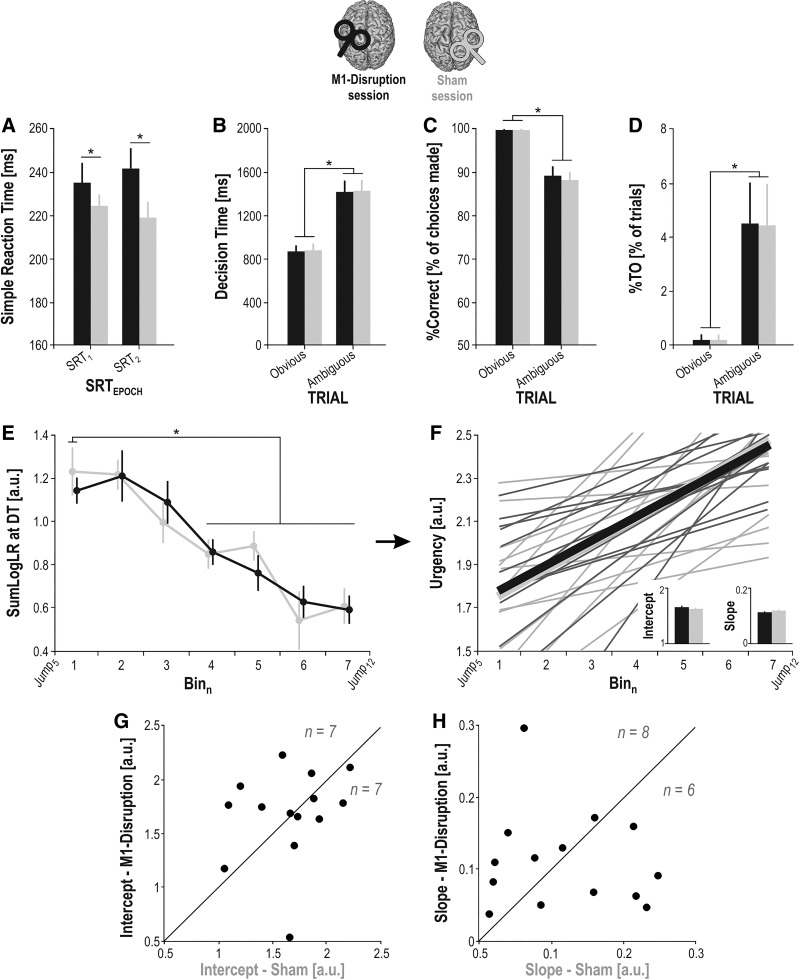
Fig. 5.
Behavioral results. A: mean simple reaction time (SRT; obtained in the SRT task) measured at each of the SRTEPOCHS (SRT1–2) in the M1-Disruption (black bars) and Sham (gray bars) sessions. B: mean decision time (DT) measured in each TRIAL (obvious, ambiguous) in the M1-Disruption (black bars) and Sham (gray bars) sessions. C and D: same as B for the percentages of correct choices (%Correct) and of time out trials (%TO), respectively. E: sum of log-likelihood ratios (SumLogLR) at DT measured in each Binn of decision time (i.e., between Jump5 and Jump12; see main text) in the M1-Disruption (black traces) and Sham (gray traces) sessions. F: urgency functions computed based on the rectified SumLogLR at DT for the M1-Disruption (black traces) and Sham (gray traces) sessions. Small bar graphs on the bottom right represent the group-level average intercept and slope of the functions. Light lines illustrate individual estimated urgency functions, and bold lines illustrate the mean urgency functions averaged across population. G: individual intercept values, represented for the M1-Disruption session (y-axis) as a function of the values for the Sham session (x-axis). Points above the diagonal (n = 7/14) represent the subjects showing a higher intercept in the M1-Disruption than following Sham session, whereas points below the diagonal (n = 7/14) represent the subjects showing a lower intercept in the M1-Disruption than following Sham session. H: same as G for the slope values. *Significant difference (P < 0.05). Error bars represent SE. a.u., Arbitrary units; M1, primary motor cortex.

