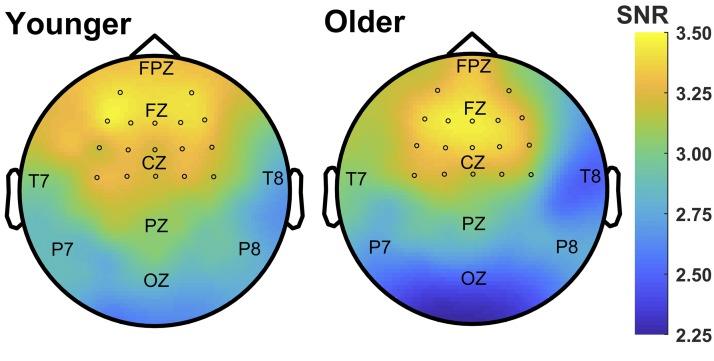
Fig. 2.
Scalp topography of the auditory steady-state response (ASSR) at 80 Hz in response to an 80-Hz amplitude-modulated signal. Maps show the group-averaged spectral amplitude of the 80-Hz ASSR (in signal-to-noise ratio, SNR) for younger and older listeners. Maximal spectral amplitude is observed over frontal regions on the scalp. Circles indicate channels used in the cluster analysis.

