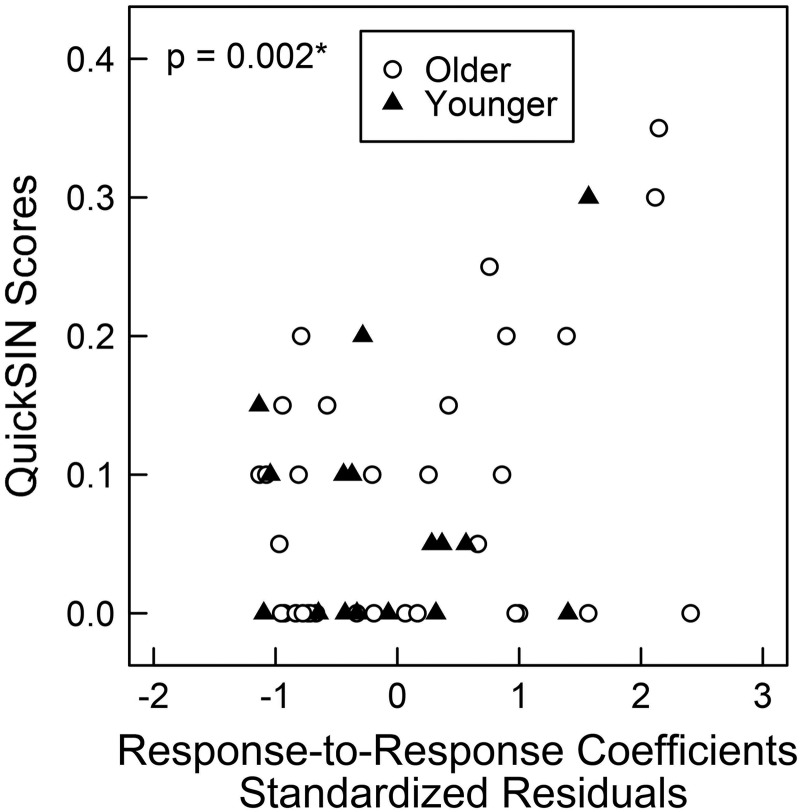
Fig. 6.
Scatterplots showing 0-dB QuickSIN scores by the standardized residuals of response-to-response correlation coefficients. The x-axis is the standardized residuals of response-to-response correlation coefficients after controlling for pure-tone thresholds from 2 to 4 kHz. Each symbol represents data from a single participant. Closed triangles indicate younger participants, and open circles indicate older participants. Zero-inflated beta regressions were implemented within a GAMLSS framework that separately models QuickSIN scores equal to 0 and QuickSIN scores between 0 and 1. P values indicate significance of regression coefficient estimates. *QuickSIN scores are significantly predicted by response-to-response correlation coefficients in zero-inflated beta regressions, after controlling for multiple comparisons and calculation of 95% confidence intervals.

