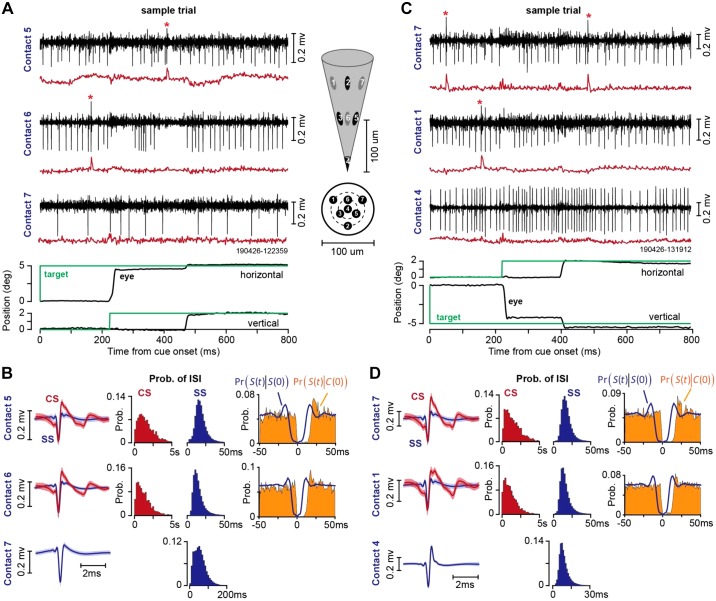
Fig. 8.
Example of heptode recordings during two sessions in the saccade task. A: sample trial, illustrating activity of a Purkinje cell on contact 5, another Purkinje cell on contact 6, and an unidentified neuron on contact 7. Black traces are high-pass-filtered voltages, and red traces are low-passed-filtered signal (300-Hz cutoff). Inset shows the geometry of the heptode and the location of each contact. B: spike waveforms and patterns of spike timing recorded from the session in A. CS is complex spike, SS is simple spike, and ISI is interspike interval. Pr[S(t)|S(0)] is the probability of a simple spike at time t, given that a simple spike occurred at time 0. Pr[S(t)|C(0)] is the probability of a simple spike at time t, given that a complex spike occurred at time 0. C: sample trial recorded in a different session, illustrating activity of a Purkinje cell on contact 7, another Purkinje cell on contact 1, and an unidentified neuron on contact 4. D: spike waveforms and patterns of spike timing recorded from the session in C. Bin size is 1 ms for conditional probabilities, 200 ms for probability of complex spike ISI, and 2 ms for probability of simple spike ISI. Error bars on spike waveforms are SD. Prob., probability.

