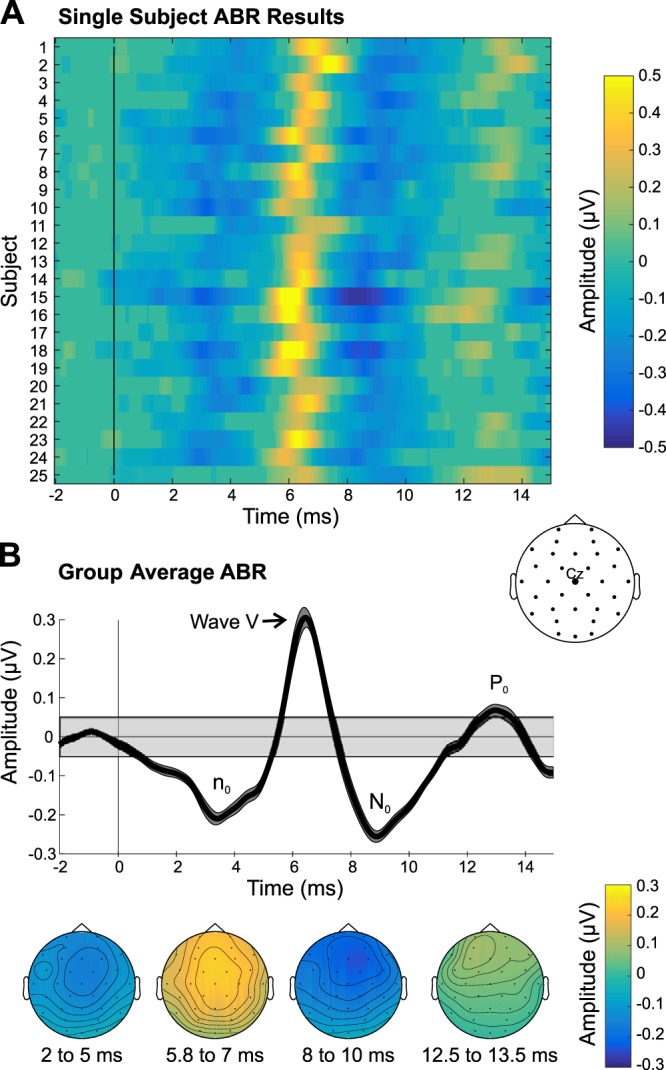
Fig. 2.

Auditory brainstem response (ABR) results. A: single-subject ABRs in channel Cz are shown, thresholded at P < 0.001, with nonsignificant data samples set to an amplitude of 0 µV. B: group-average ABRs derived from the bootstrapping procedure are shown. Top: group-average time waveform. Bottom: group-average scalp topographies of the significant deflections are displayed below. Gray shaded box in the group time waveform plot depicts the group average (plus means ± SE) range of amplitudes that were not significant, using a P threshold of 0.001.
