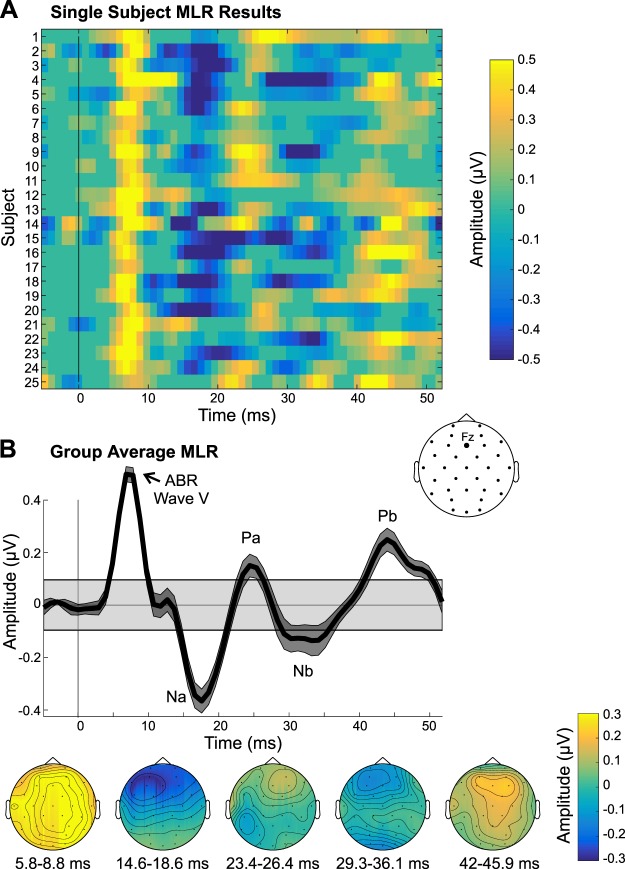
Fig. 3.
Middle latency response (MLR) results. A: single-subject MLRs in channel Fz are shown, thresholded at P < 0.001, with nonsignificant data samples set to an amplitude of 0 µV. B: group-average MLR time waveform is shown, along with the scalp topographies of the significant MLR components. Gray shaded box in the group time waveform plot depicts the group average (plus means ± SE) range of amplitudes that were not significant, using a P threshold of 0.001. ABR, auditory brainstem response.

