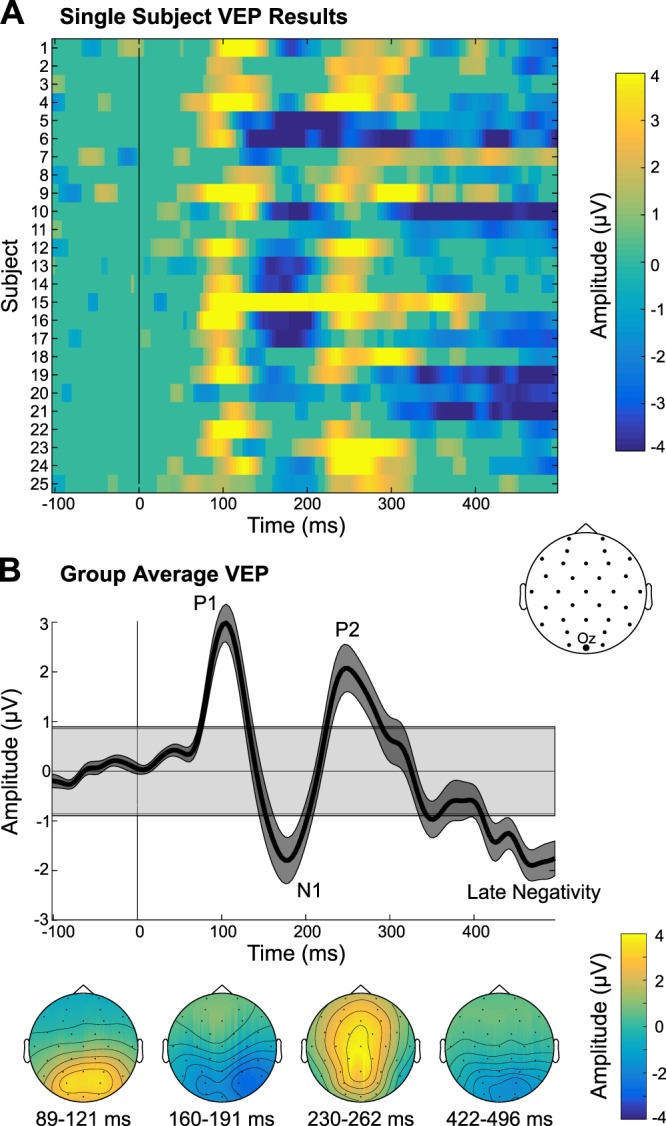
Fig. 5.

Visual evoked potential (VEP) results. A: single-subject VEPs in channel Oz are displayed, which have been thresholded at P < 0.001, with nonsignificant data samples set to an amplitude of 0 µV. B: group-average VEP time waveform is shown, along with the scalp topographies of the significant VEP components. Gray shaded box in the group time waveform plot depicts the group average (plus means ± SE) range of amplitudes that were not significant, using a P threshold of 0.001.
