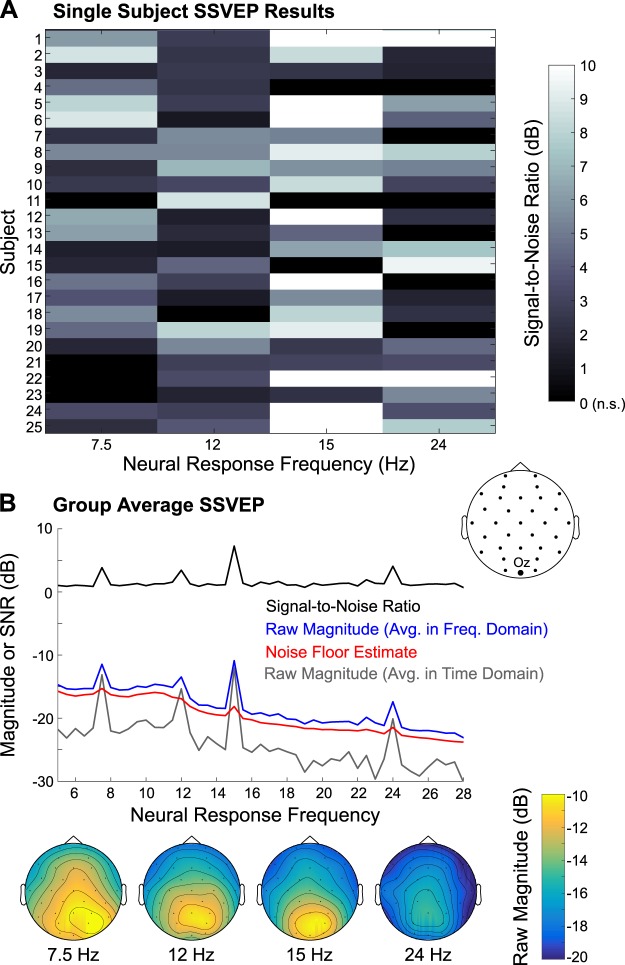
Fig. 7.
Steady-state visual evoked potential (SSVEP) results. A: single-subject responses, indicating signal-to-noise ratio at 7.5 Hz (inner ring), 12 Hz (outer ring), 15 Hz (inner ring harmonic), and 24 Hz (outer ring harmonic), are displayed, for channel Oz. Nonsignificant (n.s.) SSVEP responses were set to 0 dB. B: group-average raw SSVEP magnitude and the signal-to-noise ratio, along with the noise floor estimate, are depicted; these responses were created by averaging data in the frequency domain. Additionally, the raw magnitude computed by averaging data in the time domain before converting to the frequency domain is plotted. Below are the group-average scalp topographies of the raw SSVEP magnitude (averaged in the frequency domain) at the 4 frequencies of interest.

