Fig. 3.
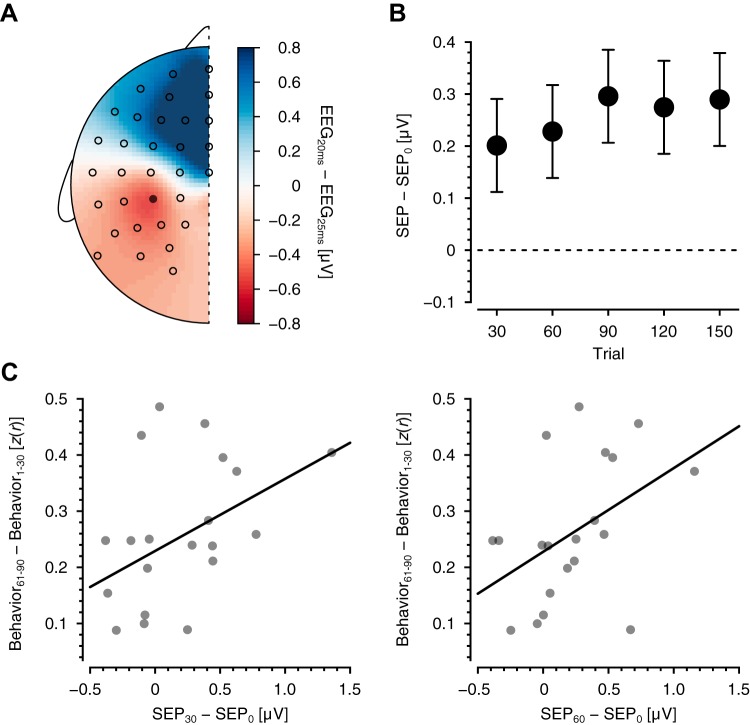
Changes in somatosensory cortical excitability. A: scalp voltage distribution associated with the N20–P25 component of the somatosensory evoked potential (SEP). The distribution is the average over all subjects and all stimulation blocks. Circles represent the positions of EEG electrodes, and the closed circle is electrode CP3. B: changes relative to baseline SEP in the N20–P25 potential at CP3 after every 30 behavioral trials. Data are means ± SE. C: relationship between changes in N20–P25 magnitudes at early stages of learning (after trials 30 and 60) and the block at which performance reached asymptote (trials 61–90). z(r), Fisher r-to-z transform.

