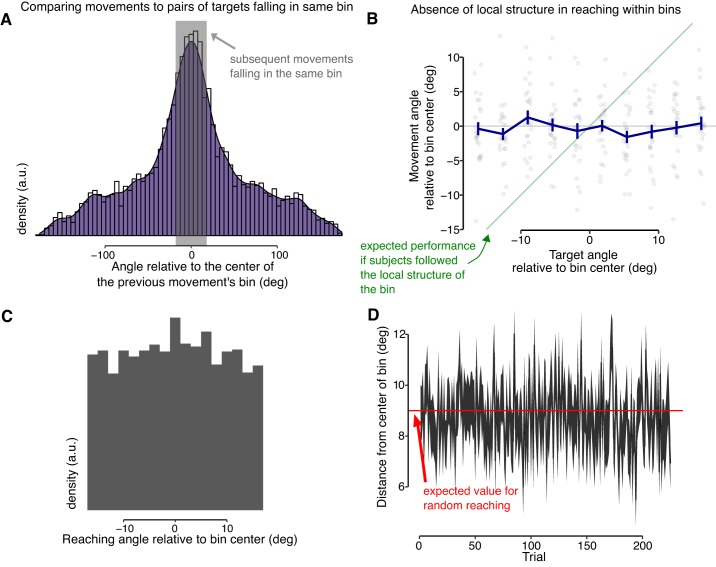
Fig. 4.
The scale of the permutation corresponded roughly to the scale of the errors made by subjects in the task. A: distribution of movement angles relative to the center of the bin of the movement on the previous trial. The gray area indicates the width of the bin and represents subsequent movements that land in the same bin. This indicated that only in a small portion of trials did subjects subsequent movements to similar targets land in the same permutation bin; a.u., arbitrary units. B: if participants matched the local structure, then within each bin the reaching angle should increase with target angle. Here are indicated trials in which subjects landed in the correct bin. Each bin was then divided into 10 subbins (horizontal axis), and the subjects’ average movements are indicated in gray dots (vertical axis) with averages (and SE) indicated in blue. Reaching angles did not increase with target angle, indicating that participant performance does not match the local structure within each bin. C: note that although subjects’ average movements were in the center of the bin, the individual movements were distributed uniformly within each bin (here shown for all subjects combined; first 100 trials discarded for display). D: if subjects learn to reach to the center of the bins, this should reduce the distance between reach angle and the bin center, but that distance was stable over the course of training. Shown is average ± SE of the (absolute) distance between reach angle and the center of the bin. The red trace indicates the expected distance for uniform reaching (which is 9° for an 18° bin).

