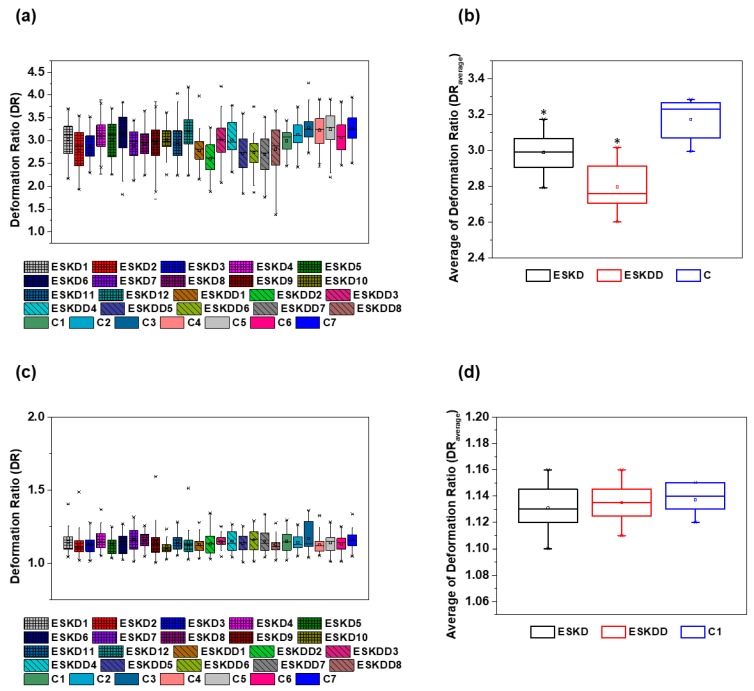
Figure 8.
Box plot representation of RBC’s deformation ratio (DR) measured by the proposed microfluidic device: (a) DR of individual donors, including ESKD patients, ESKD patients with diabetes and healthy donors (control) in the hyperbolic constriction, (b) Average DR of the groups of donors, including ESKD patients, ESKD patients with diabetes and healthy donors (control) in the hyperbolic constriction, (c) DR of individual donors, including ESKD patients, ESKD patients with diabetes and healthy donors (control) at the expansion region, (d) Average DR of the groups of donors, including ESKD patients, ESKD patients with diabetes and healthy donors (control at the expansion region. The asterisks (*) indicates statistically significant differences (p < 0.05) determined by Student’s t test.

