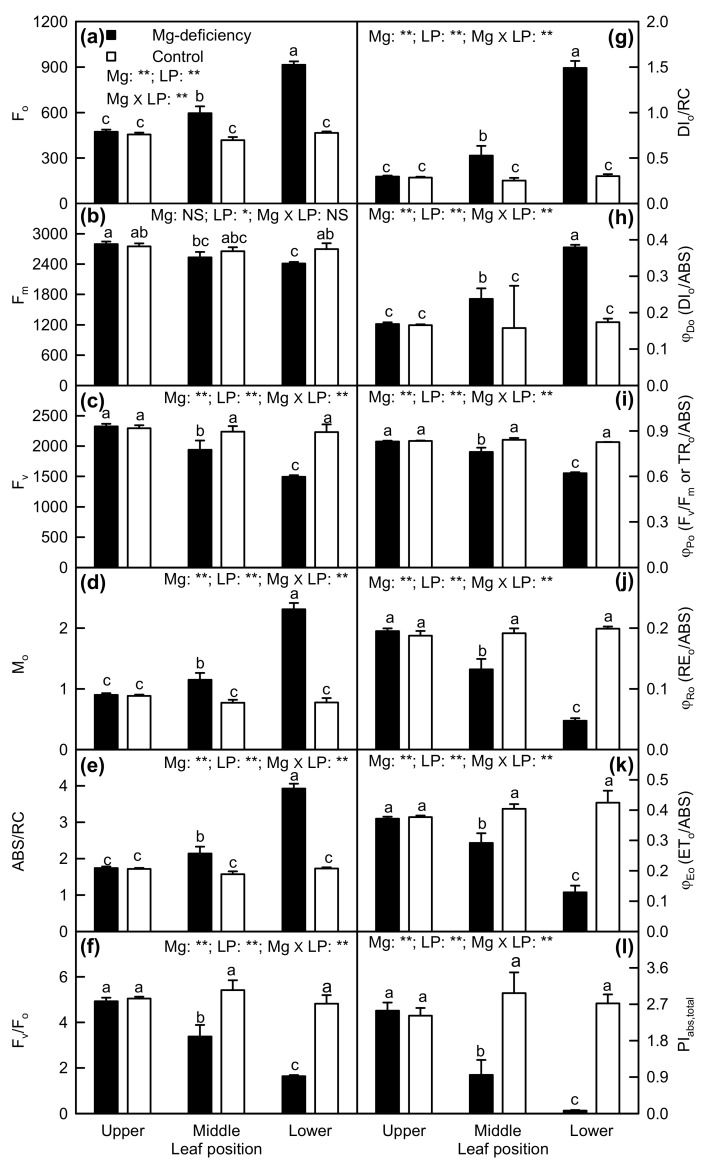
Figure 6.
Mg-deficiency effects on Fo (a), Fm (b), Fv (c), Mo (d), ABS/RC (e), Fv/Fo (f), DIo/RC (g), DIo/ABS (h), Fv/Fm (i), REo/ABS (j), ETo/ABS (k) and PIabs,total (l) in C. sinensis leaves. Bars represent the mean ± standard error (n = 4). Data were analyzed by two-way ANOVA (three (leaf positions) × two (Mg levels)) followed by Duncan's multiple range. Different letters above the bars indicate a significant difference at p < 0.05. NS, *, and ** indicate nonsignificant, significant at 5% and 1% level, respectively. LP, leaf position.

