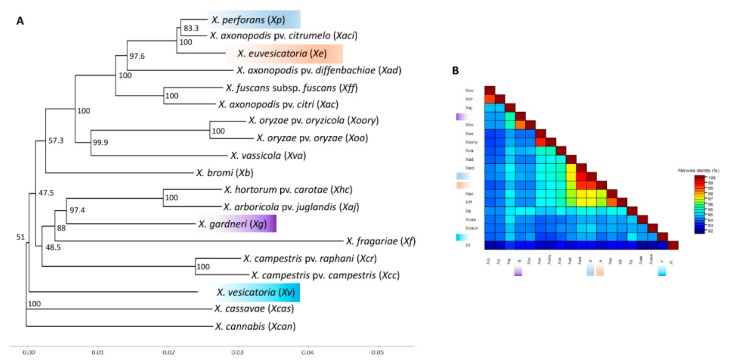
Figure 4.
Phylogenetic positions of Xanthomonas euvesicatoria and X. vesicatoria and other Xanthomonas species using chromosomal replication initiator factor (dnaA), type I glyceraldehyde-3-phosphate dehydrogenase (gapA), DNA topoisomerase (ATP-hydrolyzing) subunit B (gyrB), hydroxymethylbilane synthase (hmbs), pyruvate dehydrogenase (pdg), molecular chaperone DnaK (dnaK), sugar ABC transporter permease (lacF), elongation factor G (fusA), and citrate synthase (gltA) genes. (A) Phylogenetic tree showing the positions of Xanthomonas species, (B) color-coded heat map generated from concatenated sequences of nine complete genes (mentioned above). Numbers on the nodes represent bootstrap values and are presented as a percentage of 1000 replicates. Line in the bottom represents the scale bar that shows the distance between the species.

