Figure 5.
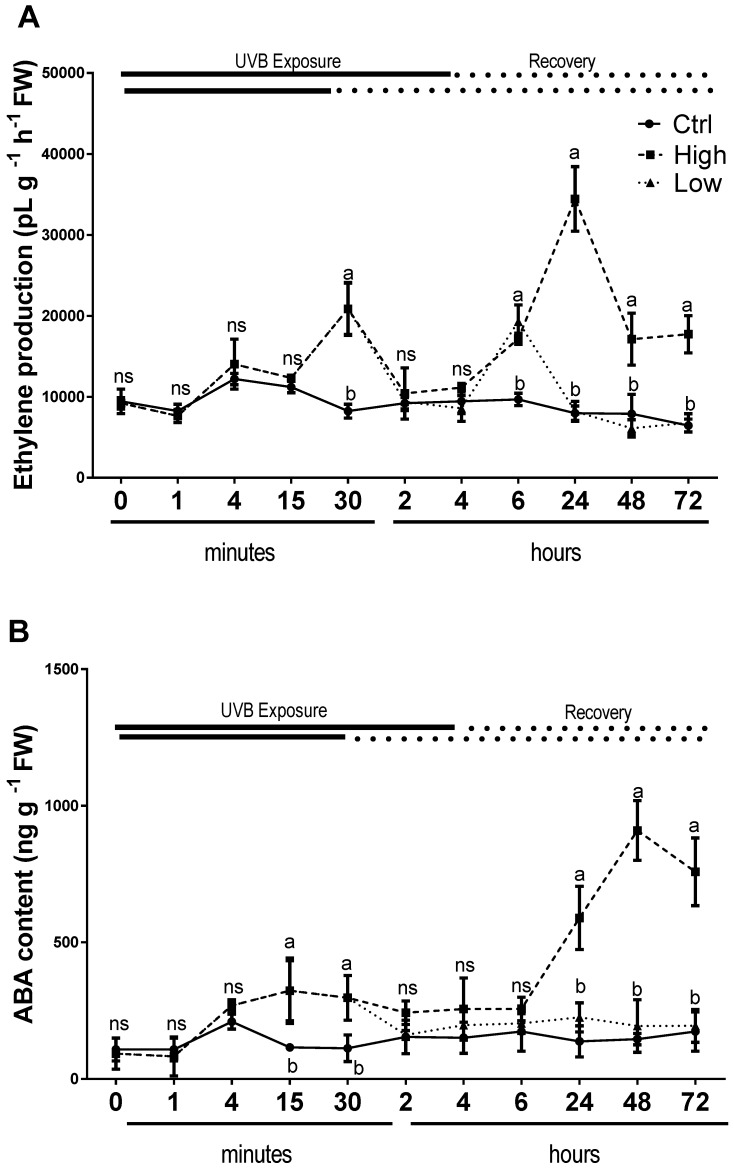
Time course of ethylene (A) emission and ABA content (B), in sweet basil cv. Genovese irradiated with low UV-B light (30 min: 8.5 kJ m−2 day−1), high UV-B light (4hours: 68 kJ m−2 day−1) or not exposed (control). Data are shown as mean with at least 5 independent biological replicates. The measurements are carried out at 0 1, 4, 15, and 30 min, as well as 2, 4, 6, 24, 48, and 72 h from the beginning of exposure. Data were subjected to analysis of variance and differences between UV-B doses were analyzed by a Tukey’s multiple comparisons test. Different letters within the same time-point denote significant differences at P < 0.05. The thick line above the graph indicates the time of UV-B exposures (low: 30 min, high: 4 h, from bottom to top, respectively) and the dot line indicates the recovery period under normal light (low: 30 min, high: 4 h, from bottom to top, respectively).

