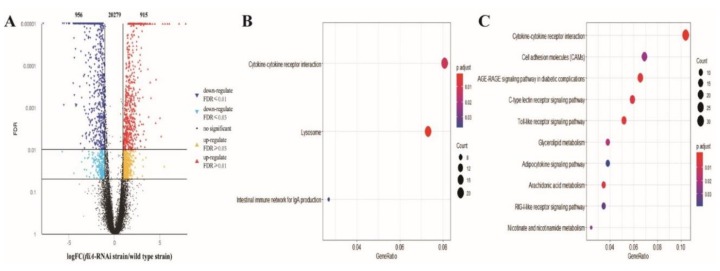
Figure 4.
Global characterization of the host transcriptome in the spleen of L. crocea infected by P. plecoglossicida. (A) Volcano plot of all genes of the spleen. X-axis: the fold change values of genes of the fliA-RNAi strain infection group/wild type strain infection group. Y-axis: statistical test value (false discovery rate (FDR)), higher values represent more significant differences. Each dot represents a particular gene: red dots denote significantly upregulated genes, blue dots significantly downregulated genes and black dots genes with non-significant differences. (B) KEGG enrichment of upregulated genes. (C) KEGG enrichment of downregulated genes. In B and C, the X-axis shows the GeneRatio, whereby a higher value indicates more genes enriched in the pathway; the Y-axis shows the enriched pathways, and the more red the dot is, the more significant is the pathway.

