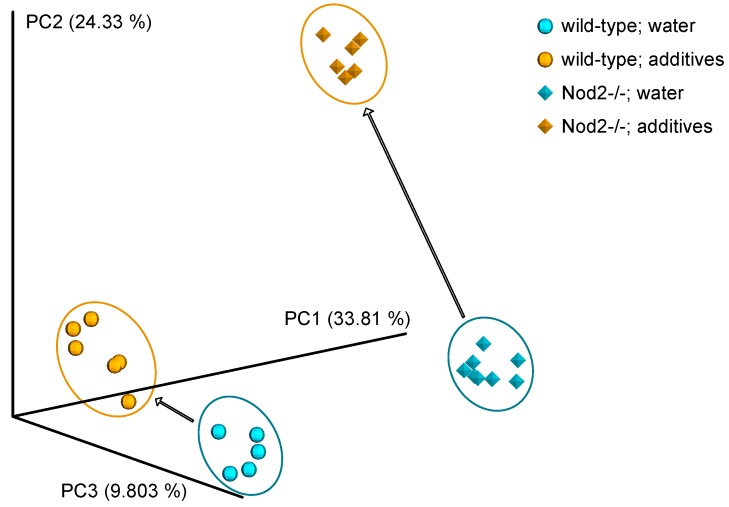
Figure 3.
Principal coordinate analysis (PCoA) plot shows the difference in beta diversity (Jaccard) between the microbiota of wild-type and Nod2-/- mice and also the effect of additives on the microbiota composition. Each point represents the microbiota of single mouse, and the distance between points represents the dissimilarity of the microbiota. The axis percentages indicate the proportion of the data variation captured by each principal coordinate. The most contributing variable to PC1 is genotype and to PC2 and PC3 treatment.

