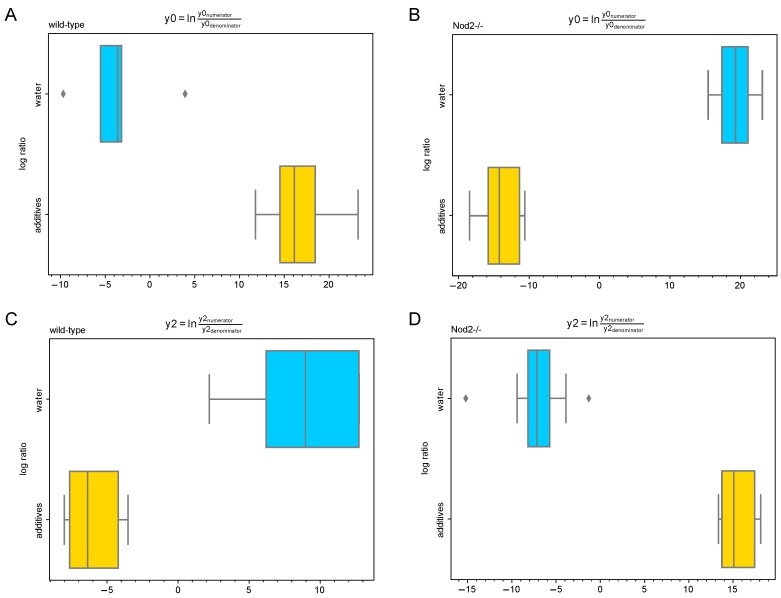
Figure 8.
Log-ratios of balances significantly different among control and additive-treated groups. Balances (A,B) y0 and (C,D) y2 in both wild-type and Nod2-/- groups were identified by Gneiss analysis as significantly different. A lower log-ratio shows a shift in the balance toward denominator ASVs, while a higher log-ratio shows a shift toward numerator ASVs.

