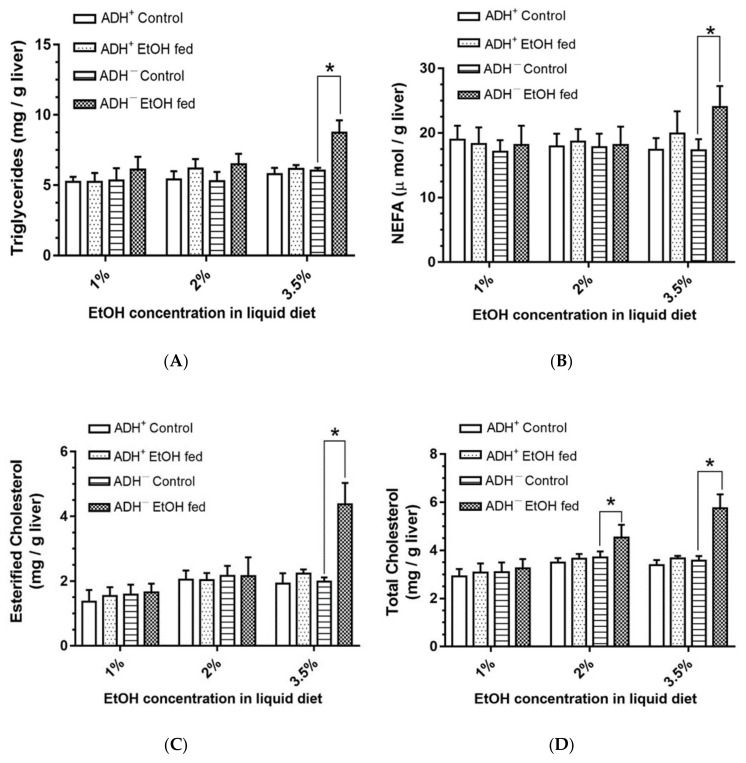
Figure 4.
Triglycerides (A), non-esterified fatty acids (NEFA) (B), esterified cholesterol (C) and total cholesterol (D) levels in the livers of ADH− and ADH+ deer mice fed 1%, 2% or 3.5% EtOH daily for 2 months. Values are means ± SEMs (n = 5). * p ≤ 0.05 for EtOH-fed ADH− versus pair-fed control ADH− deer mice.

