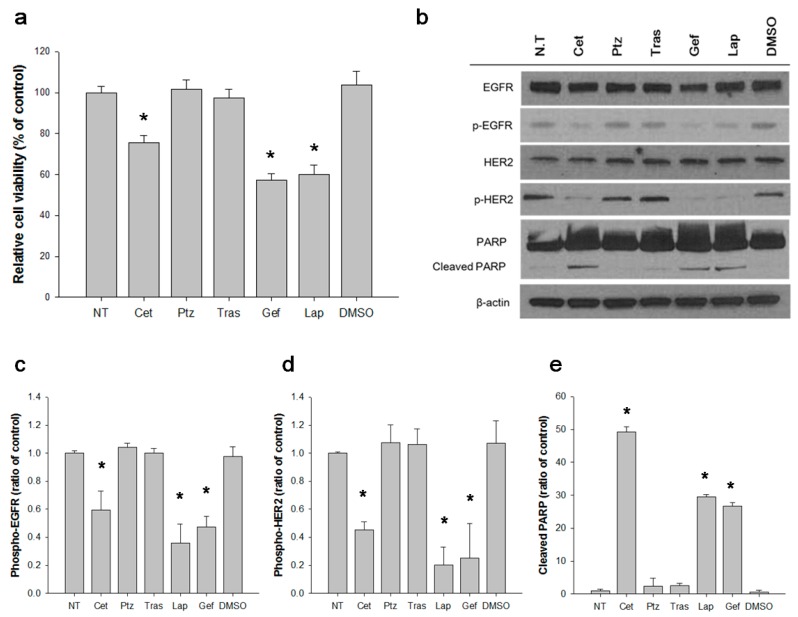
Figure 3.
Inhibition of 5637 cell proliferation and receptor activation by anti-HER2 and anti-EGFR agents. Cells were treated with HER2 or EGFR inhibitors for 96 h. (a) Cell viability was measured by WST-1 kit as described in materials and methods. Relative cell viability as a percent was determined as ((absorbance in each treatment set—absorbance in untreated set)/absorbance in non-treated set X 100). Results represent the mean ± SD obtained from three independent experiments. * p < 0.05. (b) The cell lysate was subjected to immunoblot analysis to visualize the relative phosphorylation level EGFR (c) and HER2 (d) and the level of cleaved PARP (e) Each of these levels were quantified by densitometry and plotted, individually. * p < 0.005. NT; not treated, Cet; Cetuximab, Ptz; Pertuzumab, Gef; Gefitinib, Lap; Lapatinib, DMSO; dimethyl sulfoxide, PARP; poly (ADP-ribose) polymerase.

