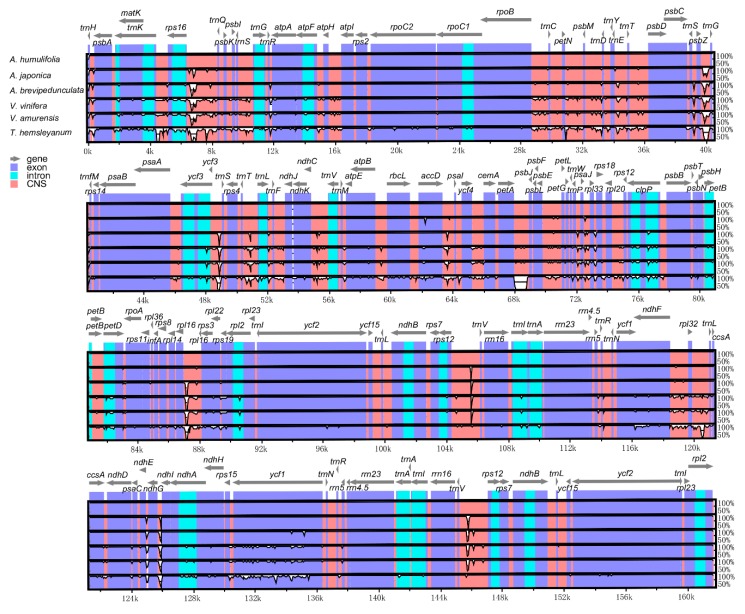
Figure 4.
Comparison of six chloroplast genomes, with A. humulifolia as a reference using mVISTA alignment program. Grey arrows above the alignment present the orientation of genes. Violet bars indicate exons, cyan bars indicate introns, and salmon bars indicate non-coding sequences (CNS). The y-axis indicates the identity percentage ranging from 50 to 100%.

