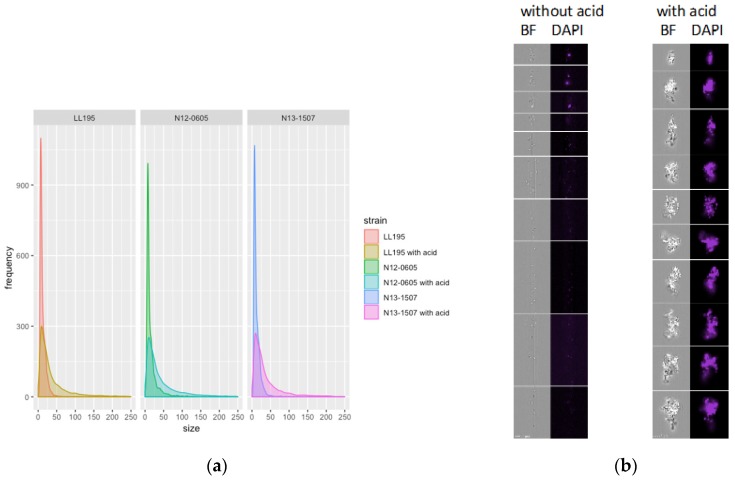
Figure 2.
Morphological changes after HCl acid stress. (a) Flow cytometric analysis of cell size with and without acid. Each dataset represents 10’000 cells. (b) Image stream analysis of L. monocytogenes cells without (left) and with (right) acid stress. For each dataset, 10,000 cells were imaged. The figure contains representative images (left column: brightfield; right column: DAPI) from among the largest entities within each dataset.

