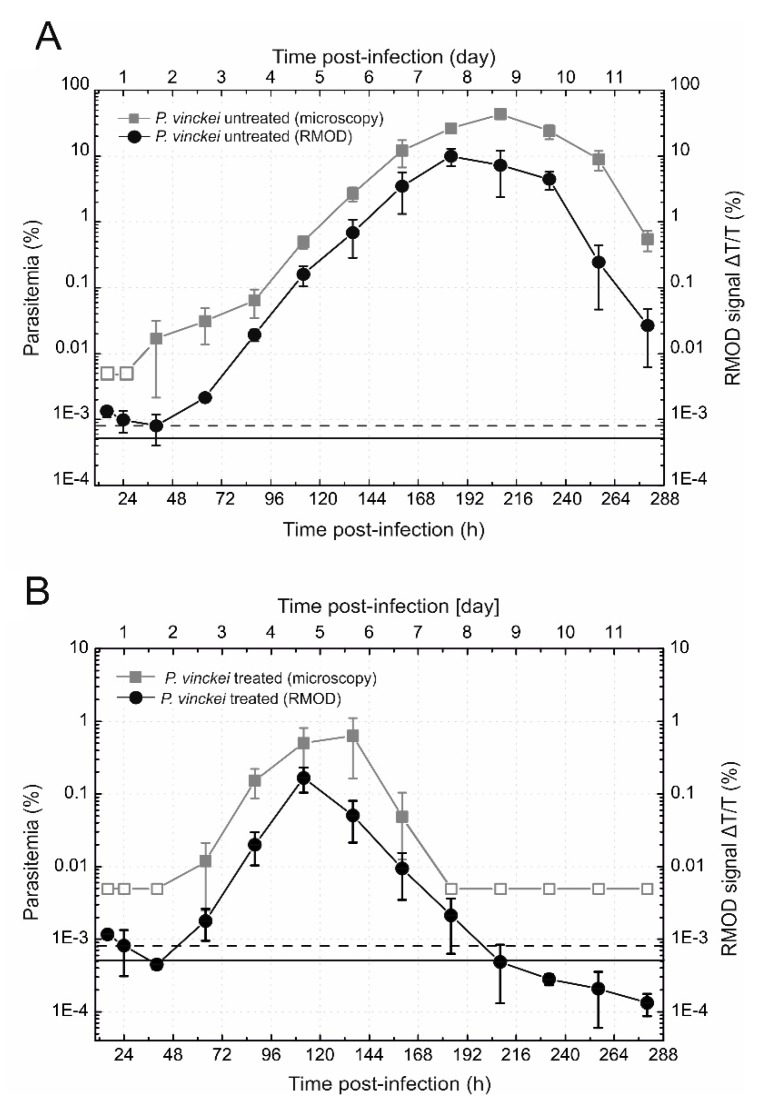
Figure 3.
Monitoring of the self-resolving P. vinckei blood-stage infection and its course during chloroquine treatment. (A) Monitoring the development of the P. vinckei infection. The gray squares represent the parasitemia values determined by microscopy; the empty squares show samples declared negative after counting 10,000 red blood cells. The black circles represent the RMOD signal. (B) Monitoring the effect of chloroquine treatment in P. vinckei infections. The gray squares represent the parasitemia values determined by microscopy; the empty squares show the negative samples. The black circles represent the corresponding RMOD signal. The chloroquine treatment started after the sampling at 112 h post-infection. Both in panel (A) and (B), each symbol and error bar represents the average and standard deviation of values measured on blood samples from n = 4 mice. The continuous black line represents the average of the RMOD values of ~20 uninfected control samples. The dashed black lines indicate the detection limit defined as the average plus two times the standard deviation of the uninfected values.

