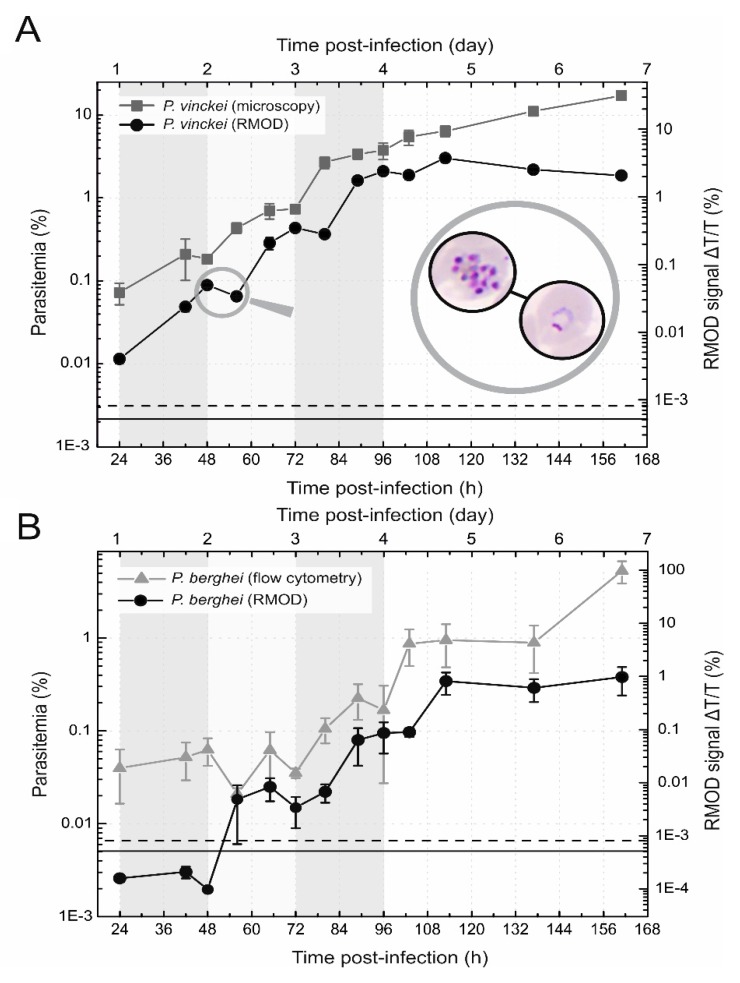
Figure 4.
Detection of cyclic development of intra-erythrocytic P. vinckei and P. berghei infection. (A) The cyclic development of the P. vinckei infection. The black circles represent the RMOD signal, while the gray squares represent the parasitemia values determined by microscopy. Each symbol and error bar represents the average and standard deviation of values measured on blood samples from n = 5 mice. The magnifying glass shows the pictures taken during the examination of smears at 48 h and at 56 h post-infection, displaying the parasitic stage most representative of the given smear; i.e. schizonts and rings, respectively. (B) The cyclic development of P. berghei parasites at the beginning of the blood stage infection. The black circles represent the RMOD signal, while the gray triangles represent the parasitemia values determined by flow cytometry. Each symbol and error bar represents the average and standard deviation of values measured on blood samples from n = 4 mice. The background shading indicates the assessed layout of the first three 24-hour erythrocytic cycles. The continuous black line represents the average of the RMOD values of ~20 uninfected control samples. The dashed black lines indicate the detection limit defined as the average plus two times the standard deviation of the uninfected values.

