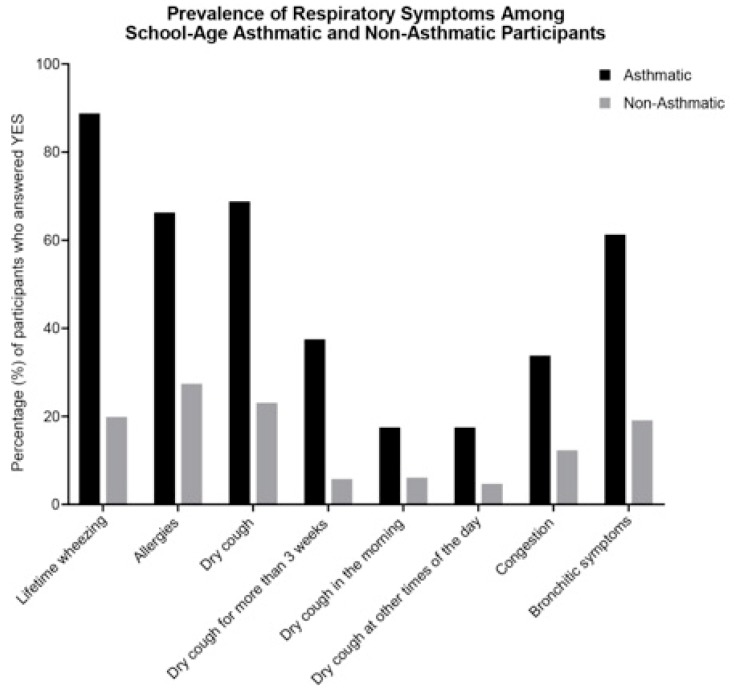
Figure 1.
Prevalence of reported respiratory symptoms among school-age participants. Bars represent percentage of asthmatics (n = 80; black bars) and nonasthmatics (n = 277; gray bars) who were reported to have any of the listed respiratory symptoms in the past 12 months, unless otherwise specified.

