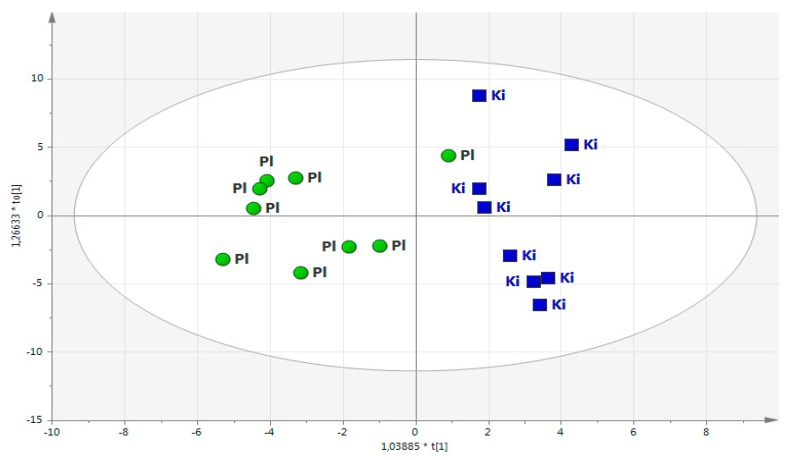
Figure 1.
OPLS-DA score plot based on each individual’s metabolic profile. (R2X = 0.19, R2Y = 0.57, Q2Y = 0.18). Note: Round circles indicate the men that received the placebo (Pl, green; n = 9), and the squares are men treated with SeQ10 (Ki, blue; n = 9). Note: The metabolite pattern was determined in plasma at the time point of 18 months (T18). Note: One of the individuals receiving placebo took SeQ10 by self-administration.

