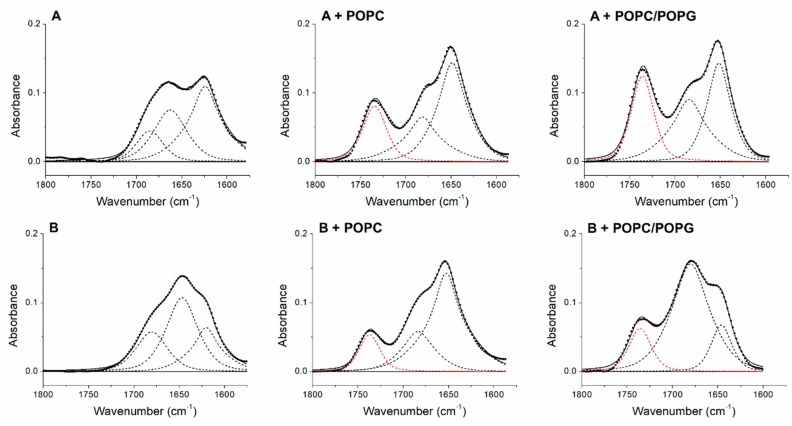
Figure 6.
Amide I′ band decomposition of the peptide +2 (A) and +5 (B) alone and in the presence of MLVs composed of POPC and POPC/POPG. Dashed lines are the individual Voigt bands fitted to the spectrum. The dotted lines represent the original absorbance amide I′ bands and the continuous lines are the sum of the individual components. The red dashed lines are the C=O group absorption bands of the phospholipids. The numerical values are reported in Table 2.

