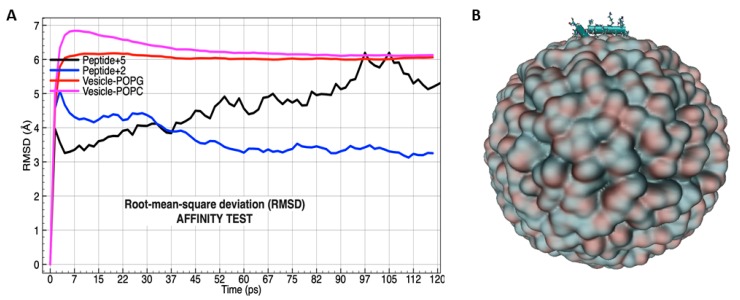
Figure 7.
RMSD (root mean square deviation) by affinity test between peptide +2 (blue line) and peptide +5 (black line) in accordance with POPG and POPC (red and magenta lines, respectively) phospholipids in vesicle conformation (A). Molecular orientation of peptide onto lipid bilayer conformation in double layered spherical vesicle POPC and POPG (B). Peptide is shown by CPK coloring convention, and the vesicle by the drawing method that use the isosurface extracted from a volumetric Gaussian density map, called: QuickSurf [53].

