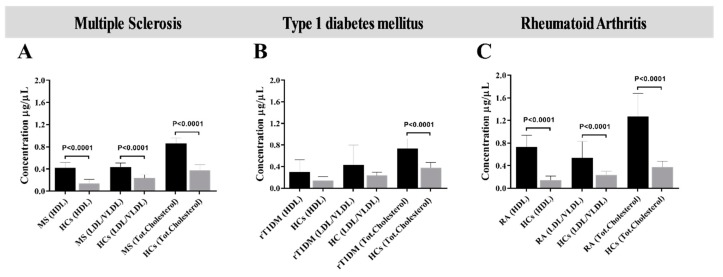
Figure 1.
Levels of serum lipoproteins determined through disease-specific analysis. Bars show values were determined in samples from patients (A) with MS, (B) at risk of T1DM (rT1DM) and (C) affected by RA, each analyzed with reference to concentrations obtained for healthy controls (HCs). p-values are specified for each group when statistically significant. Standard deviation is shown for each bar.

