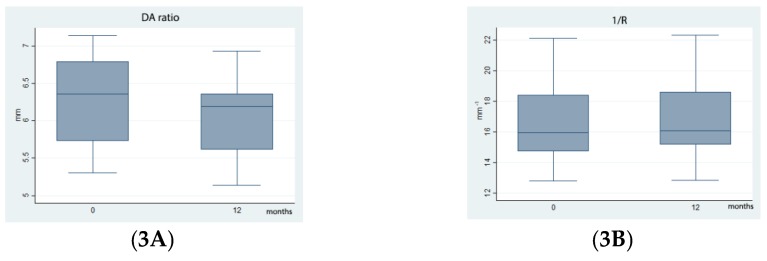
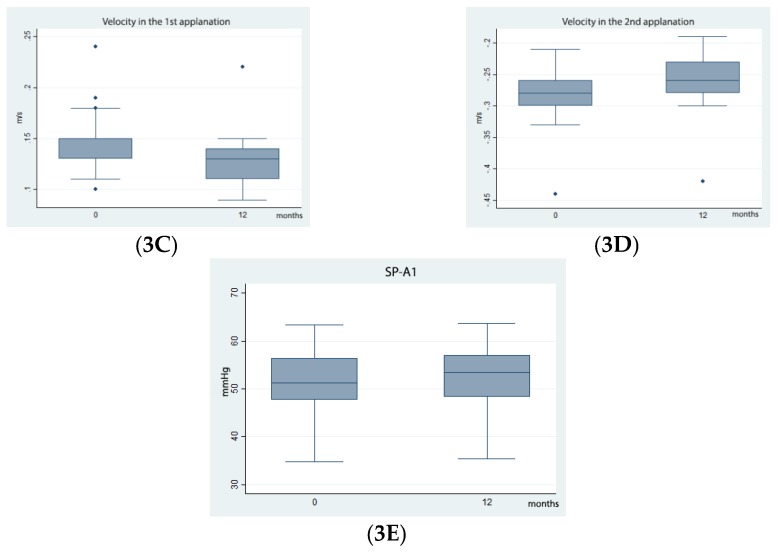
Figure 3.
Biomechanical changes after CXL.
Note: A statistically significant difference was noted between baseline and post-surgical distribution of DA Ratio(3A), 1/R (3B), Appl 1 Velocity (3C),Appl 2 Velocity (3D) andSP-A1 (3E) (p < 0.05).The boxes represent the 25th and 75th percentiles; the whiskers are the lines extending from each end of the box to the minimum or maximum or the lowest datum within 1.5-fold the inter quartile range (IQR) of the lower quartile or the highest datum within 1.5-fold IQR of the upper quartile. The median value is the line that bisects the boxes and the circles are the outlier values.Follow-up time in months on the horizontal axis. mm = millimeters


