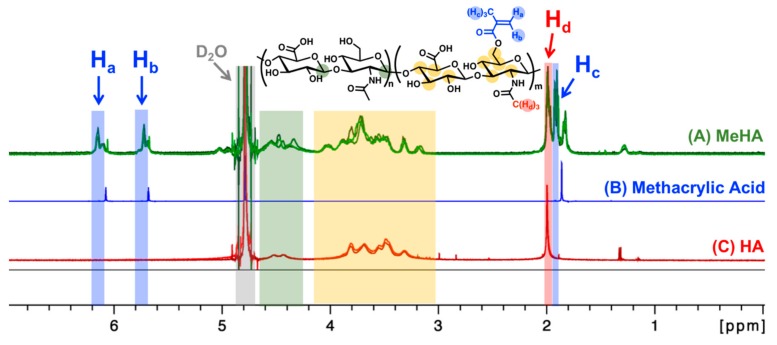
Figure 1.
1H-NMR spectra of methacrylated hyaluronic acid (A, MeHA; three samples; green lines), methacrylic acid (B, blue line), and unmodified hyaluronic acid (C, HA; two samples; red lines). Methacrylate peaks (blue arrows; δ 6.2 ppm, δ 5.8 ppm, δ 1.9 ppm; Ha, Hb, Hc) were used to calculate the degree of methacrylation (Table 1). The methyl group proton on the N-acetylglucosamine is between δ 2.0–2.1 ppm (red arrow; Hd). D2O solvent peak was set to 4.79 ppm (gray area) [27]. The color-coded protons in the chemical structure (top center) are expected to show up in the color-matching boxed regions within the 1H-NMR spectra (A–C).

