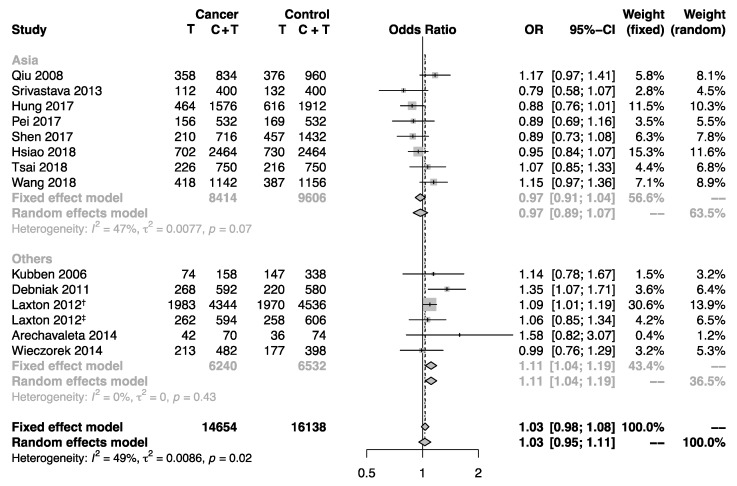
Figure 3.
Forest plot showing the association between the MMP-8 rs11225395 polymorphism and cancer risk in subgroup analysis by region. The pooled estimates were calculated under the allele model. The size of each gray square is proportional to the weight calculated under the fixed effect model, a black dot in a box indicates the odds ratio (OR), and black lines on either end mark the corresponding 95% confidence interval (CI). The gray diamonds represent the overall summary estimate, with 95% CI represented by their widths. The dotted vertical line and the dashed one indicate the pooled ORs calculated by the random effects model and fixed effect model, respectively. The black unbroken vertical line marks the null hypothesis (OR = 1). † marks the population of the United Kingdom in Laxton’s study (2012), and ‡ marks the population of Poland in Laxton’s study (2012).

