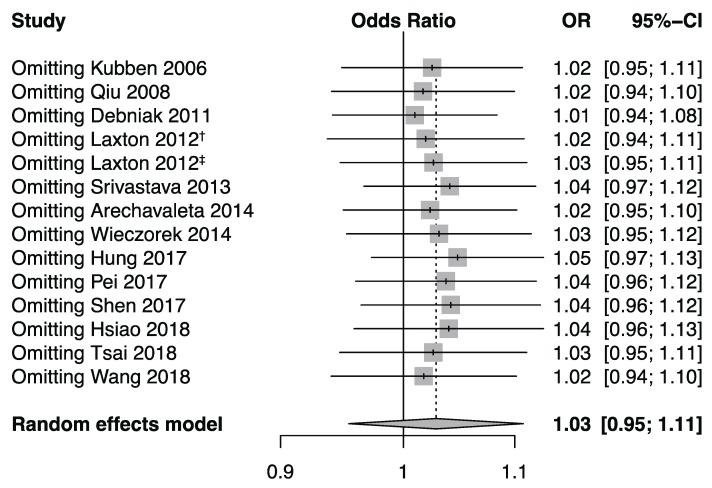
Figure 5.
Forest plot for sensitivity analysis under the allele model. Pooled estimates were calculated using the random effects model. The named study was omitted to reappraise the association between the MMP-8 rs11225395 polymorphism and cancer risk. † marks the population of the United Kingdom in Laxton’s study (2012), and ‡ marks the population of Poland in Laxton’s study (2012).

