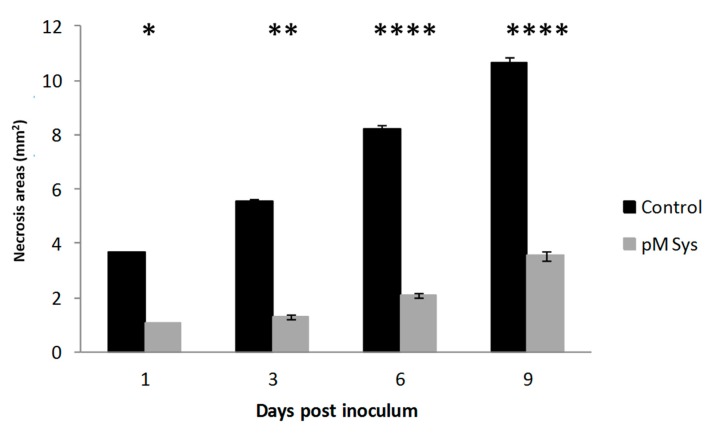
Figure 4.
Enhanced resistance to Botrytis cinerea of Sys treated leaves. Response to B. cinerea infection by leaves of plant treated with 100 pM Systemin. The graphs display the average (± S.D.) of the lesion size at 1, 3, 6 and 9 days post inoculum. Asterisks denote statistically significant differences (T-test: * p < 0.05; ** p < 0.01; *** p < 0.001; **** p < 0.00001).

