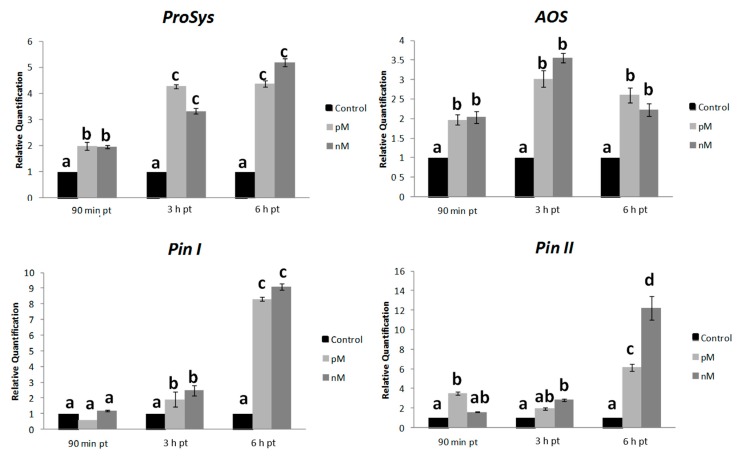
Figure 7.
Gene expression analysis in leaf treated with Sys (local). Quantification of transcripts of early (ProSys, AOS) and late genes (Pin I, Pin II) by Reverse-Transcription-Polymerase Chain Reaction (RT-PCR) after 90 min, 3 h and 6 h following 100 pM and 100 nM systemin peptide treatment. Relative quantities are calibrated on samples obtained from tomato leaves spotted with PBS1X (Control). For each gene, relative quantification (RQ) variations have been analysed by two-way ANOVA. Different letters denote significantly different values (p < 0.01). Error bars indicate standard error.

