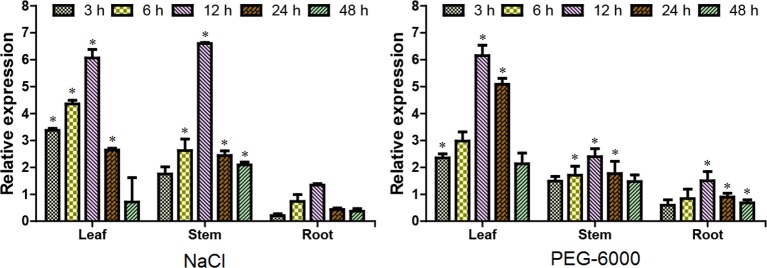
Figure 2.
Tempo-spatial expression patterns of the ERF38 gene under stresses. After 150 mM NaCl and 20% polyethylene glycol-6000 treatments at each time point of 0, 3, 6, 12, 24, and 48 h, the roots, stems, and leaves were collected and used for reverse transcriptase quantitative polymerase chain reaction. The data was processed using the 2-ΔΔCt method. The error bars represent the standard deviation. Asterisks indicate significant differences between transgenic lines and wild type lines (t test, *P < 0.05).

