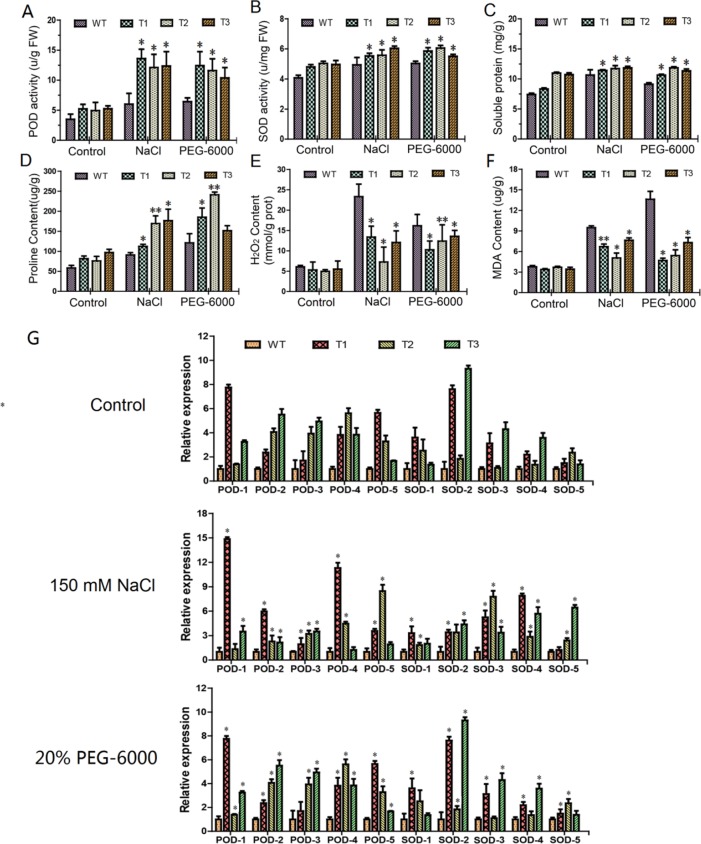
Figure 7.
Analysis of physiological and gene expression under both salt and polyethylene glycol stresses. T1–T3: different transgenic poplar lines; WT, wild type poplar. (A–F) Comparison of peroxidase (POD), superoxide dismutase (SOD), proline, soluble protein, H2O2, and malondialdehyde contents between transgenic lines and the WT; the control is water. (G) Expression of POD and SOD-related genes in transgenic plants under salt and PEG-6000 stresses. The error bars represent the standard deviation. Asterisks indicate significant differences between transgenic lines and wild type lines (t test, *P < 0.05, **P < 0.01)

